
Page 412 - Mechanics of Asphalt Microstructure and Micromechanics
P. 412
T
404 Ch a p t e r w e l v e
12.6.2.5 Rigid Membranes
Rigid membranes transmit the applied pressure uniformly to the top, bottom, and lat-
eral faces of the cubical AC specimen. They form the actual fluid barrier of the hydrau-
lic fluid acting against the cubical AC specimen. The membrane extends past the O-ring
mounted in the inner face of the wall assemblies.
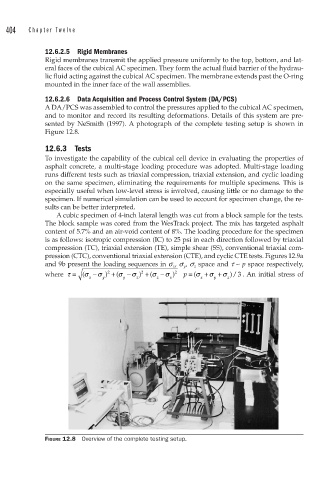
12.6.2.6 Data Acquisition and Process Control System (DA/PCS)
A DA/PCS was assembled to control the pressures applied to the cubical AC specimen,
and to monitor and record its resulting deformations. Details of this system are pre-
sented by NeSmith (1997). A photograph of the complete testing setup is shown in
Figure 12.8.
12.6.3 Tests
To investigate the capability of the cubical cell device in evaluating the properties of
asphalt concrete, a multi-stage loading procedure was adopted. Multi-stage loading
runs different tests such as triaxial compression, triaxial extension, and cyclic loading
on the same specimen, eliminating the requirements for multiple specimens. This is
especially useful when low-level stress is involved, causing little or no damage to the
specimen. If numerical simulation can be used to account for specimen change, the re-
sults can be better interpreted.
A cubic specimen of 4-inch lateral length was cut from a block sample for the tests.
The block sample was cored from the WesTrack project. The mix has targeted asphalt
content of 5.7% and an air-void content of 8%. The loading procedure for the specimen
is as follows: isotropic compression (IC) to 25 psi in each direction followed by triaxial
compression (TC), triaxial extension (TE), simple shear (SS), conventional triaxial com-
pression (CTC), conventional triaxial extension (CTE), and cyclic CTE tests. Figures 12.9a
and 9b present the loading sequences in s x , s y , s z space and t ~ p space respectively,
2
where τ = ( σ − σ ) 2 + ( σ − σ ) 2 + ( σ − σ ) p = (σ +σ +σ )/3 . An initial stress of
x y y z z x x y z
FIGURE 12.8 Overview of the complete testing setup.