Page 415 - Mechanics of Asphalt Microstructure and Micromechanics
P. 415

Characterization and Modeling  Anisotropic Proper ties of  Asphalt Concrete   407


                                               Z


                                                                             Y
                                                      TC
                                                      TE
                                                      SS
                                                      SS


                                 X

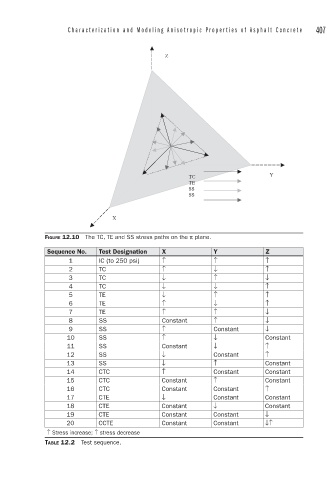
              FIGURE 12.10  The TC, TE and SS stress paths on the π plane.

              Sequence No.   Test Designation  X             Y             Z
                    1        IC (to 250 psi)  ↑              ↑             ↑
                    2        TC               ↑              ↓             ↑
                    3        TC               ↓              ↑             ↓
                    4        TC               ↓              ↓             ↑
                    5        TE               ↓              ↑             ↑
                    6        TE               ↑              ↓             ↑
                    7        TE               ↑              ↑             ↓
                    8        SS               Constant       ↑             ↓
                    9        SS               ↑              Constant      ↓
                    10       SS               ↑              ↓             Constant
                    11       SS               Constant       ↓             ↑
                    12       SS               ↓              Constant      ↑
                    13       SS               ↓              ↑             Constant
                    14       CTC              ↑              Constant      Constant
                    15       CTC              Constant       ↑             Constant
                    16       CTC              Constant       Constant      ↑
                    17       CTE              ↓              Constant      Constant
                    18       CTE              Constant       ↓             Constant
                    19       CTE              Constant       Constant      ↓
                    20       CCTE             Constant       Constant      ↓↑
              ↑ Stress increase; ↑ stress decrease
              TABLE 12.2  Test sequence.
   410   411   412   413   414   415   416   417   418   419   420