
Page 416 - Mechanics of Asphalt Microstructure and Micromechanics
P. 416
T
408 Ch a p t e r w e l v e
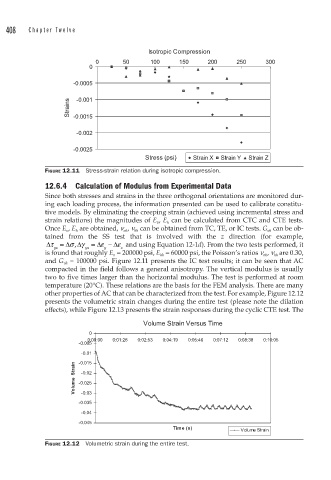
Isotropic Compression
0 50 100 150 200 250 300
0
-0.0005
-0.001
Strains -0.0015
-0.002
-0.0025
Stress (psi) Strain X Strain Y Strain Z
FIGURE 12.11 Stress-strain relation during isotropic compression.
12.6.4 Calculation of Modulus from Experimental Data
Since both stresses and strains in the three orthogonal orientations are monitored dur-
ing each loading process, the information presented can be used to calibrate constitu-
tive models. By eliminating the creeping strain (achieved using incremental stress and
strain relations) the magnitudes of E v , E h can be calculated from CTC and CTE tests.
Once E v , E h are obtained, n vh , n hh can be obtained from TC, TE, or IC tests. G vh can be ob-
tained from the SS test that is involved with the z direction (for example,
Δτ = Δσ, Δγ = Δε − Δε and using Equation 12-1d). From the two tests performed, it
yz yz y z
is found that roughly E v = 200000 psi, E hh = 60000 psi, the Poisson’s ratios n vh , n hh are 0.30,
and G vh = 100000 psi. Figure 12.11 presents the IC test results; it can be seen that AC
compacted in the field follows a general anisotropy. The vertical modulus is usually
two to five times larger than the horizontal modulus. The test is performed at room
temperature (20°C). These relations are the basis for the FEM analysis. There are many
other properties of AC that can be characterized from the test. For example, Figure 12.12
presents the volumetric strain changes during the entire test (please note the dilation
effects), while Figure 12.13 presents the strain responses during the cyclic CTE test. The
Volume Strain Versus Time
0
0:00:00 0:01:26 0:02:53 0:04:19 0:05:46 0:07:12 0:08:38 0:10:05
-0.005
-0.01
-0.015
Volume Strain -0.025
-0.02
-0.03
-0.035
-0.04
-0.045
Time (s)
Volume Strain
FIGURE 12.12 Volumetric strain during the entire test.