
Page 426 - Mechanics of Asphalt Microstructure and Micromechanics
P. 426
T
418 Ch a p t e r w e l v e
(a) (b) (c)
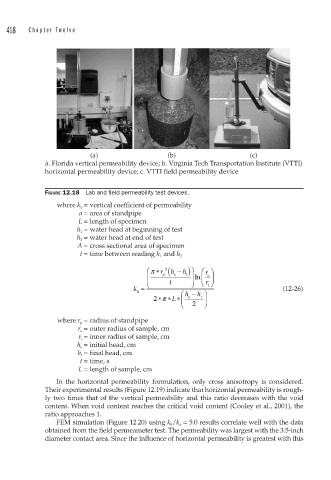
a. Florida vertical permeability device; b. Virginia Tech Transportation Institute (VTTI)
horizontal permeability device; c. VTTI field permeability device
FIGURE 12.18 Lab and fi eld permeability test devices.
where k v = vertical coefficient of permeability
a = area of standpipe
L = length of specimen
h 1 = water head at beginning of test
h 2 = water head at end of test
A = cross sectional area of specimen
t = time between reading h 1 and h 2
⎛ π ∗ r ( h − ) ⎞ r ⎛ ⎞
2
h
⎜ p o t ⎟ ln ⎜ ⎟
o
⎝
r ⎠
k = ⎝ t ⎠ i (12-26)
h ⎛ h − h ⎞
h
π
2 ∗∗ L ∗ ⎜ ⎝ o t ⎟ ⎠
2
where r p = radius of standpipe
r o = outer radius of sample, cm
r i = inner radius of sample, cm
h o = initial head, cm
h t = final head, cm
t = time, s
L = length of sample, cm
In the horizontal permeability formulation, only cross anisotropy is considered.
Their experimental results (Figure 12.19) indicate that horizontal permeability is rough-
ly two times that of the vertical permeability and this ratio decreases with the void
content. When void content reaches the critical void content (Cooley et al., 2001), the
ratio approaches 1.
FEM simulation (Figure 12.20) using k h /k v = 5.0 results correlate well with the data
obtained from the field permeameter test. The permeability was largest with the 3.5-inch
diameter contact area. Since the influence of horizontal permeability is greatest with this