
Page 108 - Mechanism and Theory in Organic Chemistry
P. 108
Interpretation of Rate Constants 97
I I I I X
x=o x=x* x= 1
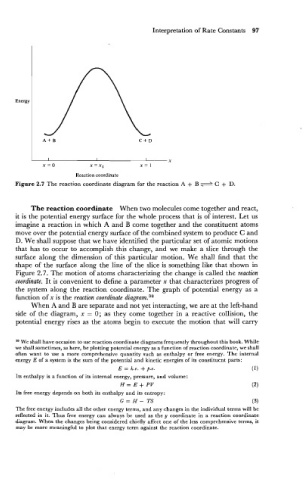
Reaction coordinate
Figure 2.7 The reaction coordinate diagram for the reaction A + B C + D.
The reaction coordinate When two molecules come together and react,
it is the potential energy surface for the whole process that is of interest. Let us
imagine a reaction in which A and B come together and the constituent atoms
move over the potential energy surface of the combined system to produce C and
D. We shall suppose that we have identified the particular set of atomic motions
that has to occur to accomplish .this change, and we make a slice through the
surface along the dimension of this particular motion. We shall find that the
shape of the surface along the line of the slice is something like that shown in
Figure 2.7. The motion of atoms characterizing the change is called the reaction
coordinate. It is convenient to define a parameter x that characterizes progress of
the system along the reaction coordinate. The graph of potential energy as a
function of x is the reaction coordinate diagram.38
When A and B are separate and not yet interacting, we are at the left-hand
side of the diagram, x = 0; as they come together in a reactive collision, the
potential energy rises as the atoms begin to execute the motion that will carry
38 We shall have occasion to use reaction coordinate diagrams frequently throughout this book. While
we shall sometimes, as here, be plotting potential energy as a function of reaction coordinate, we shall
often want to use a more comprehensive quantity such as enthalpy or free energy. The internal
energy E of a system is the sum of the potential and kinetic energies of its constituent parts:
E = k.e. + p.e. (1)
Its enthalpy is a function of its internal energy, pressure, and volume:
H=E+PV (2)
Its free energy depends on both its enthalpy and its entropy:
G=H- TS (3)
The free energy includes all the other energy terms, and any changes in the individual terms will be
reflected in it. Thus free energy can always be used as the y coordinate in a reaction coordinate
diagram. When the changes being considered chiefly affect one of the less comprehensive terms, it
may be more meaningful to plot that energy term against the reaction coordinate.