
Page 109 - Mechanism and Theory in Organic Chemistry
P. 109
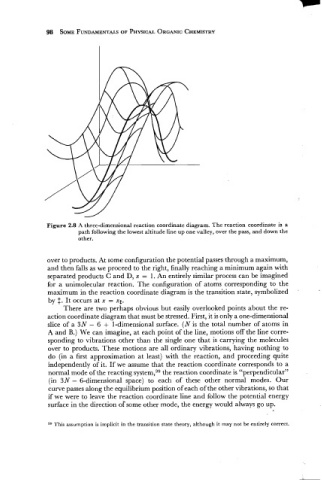
Figure 2.8  A three-dimensional reaction coordinate diagram. The reaction  coordinate is  a
                         path following the lowest altitude line up one valley, over the pass, and down the
                         other.


                over to products. At some configuration the potential passes through a maximum,
                and then falls as we proceed to the right, finally reaching a minimum again with
                separated products C and D, x  = 1. An entirely similar process can be imagined
                for  a  unimolecular  reaction.  The configuration  of  atoms  corresponding  to the
                maximum in the reaction coordinate diagram is the transition state, symbolized
                by $. It occurs at x  = x*.
                     There are two perhaps  obvious but easily overlooked points about the re-
                action coordinate diagram that must be stressed. First, it is only a one-dimensional
                slice of a  3N - 6 + 1-dimensional surface.  (N is the total number  of atoms in
                A and B.)  We can imagine, at each point of the line, motions off the line corre-
                sponding to vibrations  other than  the single one that is  carrying the molecules
                over to products.  These motions are all ordinary vibrations,  having nothing to
                do  (in a first approximation  at least) with  the  reaction,  and  proceeding quite
                independently of it. If we assume that the reaction coordinate corresponds to a
                normal mode of the reacting system,39 the reaction coordinate is "perpendicular"
                (in  3N - 6-dimensional  space)  to  each  of  these  other  normal  modes.  Our
                curve passes along the equilibrium position of each of the other vibrations, so that
                if we were to leave the reaction coordinate line and follow the potential energy
                surface in the direction of some other mode, the energy would always go up.


                39  This assumption is implicit in the transition state theory, although it may not be entirely correct.