
Page 114 - Mechanism and Theory in Organic Chemistry
P. 114
Interpretation of Rate Constants 103
Reaction coordinate
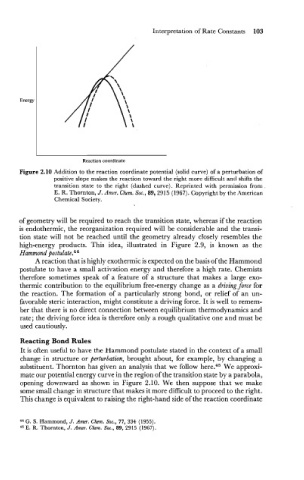
Figure 2.10 Addition to the reaction coordinate potential (solid curve) of a perturbation of
positive slope makes the reaction toward the right more difficult and shifts the
transition state to the right (dashed curve). Reprinted with permission from
E. R. Thornton, J. Amer. Chem. Soc., 89,2915 (1967). Copyright by the American
Chemical Society.
of geometry will be required to reach the transition state, whereas if the reaction
is endothermic, the reorganization required will be considerable and the transi-
tion state will not be reached until the geometry already closely resembles the
high-energy products. This idea, illustrated in Figure 2.9, is known as the
Hammond postulate.44
A reaction that is highly exothermic is expected on the basis of the Hammond
postulate to have a small activation energy and therefore a high rate. Chemists
therefore sometimes speak of a feature of a structure that makes a large exo-
thermic contribution to the equilibrium free-energy change as a driving force for
the reaction. The formation of a particularly strong bond, or relief of an un-
favorable steric interaction, might constitute a driving force. It is well to remem-
ber that there is no direct connection between equilibrium thermodynamics and
rate; the driving force idea is therefore only a rough qualitative one and must be
used cautiously.
Reacting Bond Rules
It is often useful to have the Hammond postulate stated in the context of a small
change in structure or perturbation, brought about, for example, by changing a
substituent. Thornton has given an analysis that we follow here.45 We approxi-
mate our potential energy curve in the region of the transition state by a parabola,
opening downward as shown in Figure 2.10. We then suppose that we make
some small change in structure that makes it more difficult to proceed to the right.
This change is equivalent to raising the right-hand side of the reaction coordinate
44 G. S. Hammond, J. Amer. Chem. Soc., 77, 334 (1955).
46 E. R. Thornton, J. Amer. Chem. Soc., 89, 2915 (1967).