
Page 259 - Mechanism and Theory in Organic Chemistry
P. 259
248 UNIMOLECULAR SUBSTITUTIONS AND RELATED REACTIONS
N + C-X N-C -X
- decrease -
N+c++X- N-C distance N-C + X
increase
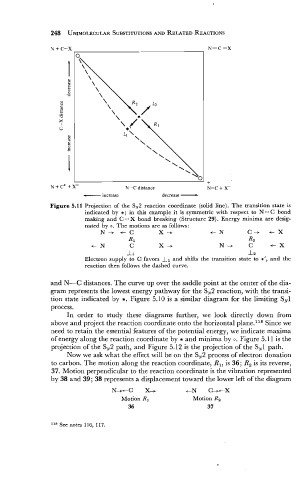
Figure 5.11 Projection of the SN2 reaction coordinate (solid line). The transition state is
indicated by *; in this example it is symmetric with respect to N...C bond
making and C...X bond breaking (Structure 29). Energy minima are desig-
nated by 0. The motions are as follows:
N-+ t C X -+ c N C-+ c X
R1 R2
c N C X -+ N-+ C t X
11 12
Electron supply to C favors Il and shifts the transition state to *', and the
reaction then follows the dashed curve.
and N-C distances. The curve up over the saddle point at the center of the dia-
gram represents the lowest energy pathway for the SN2 reaction, with the transi-
tion state indicated by *. Figure 5.10 is a similar diagram for the limiting SN1
process.
In order to study these diagrams further, we look directly down from
above and project the reaction coordinate onto the horizontal plane.l18 Since we
need to retain the essential features of the potential energy, we indicate maxima
of energy along the reaction coordinate by * and minima by 0. Figure 5.1 1 is the
projection of the SN2 path, and Figure 5.12 is the projection of the SN1 path.
Now we ask what the effect will be on the SN2 process of electron donation
to carbon. The motion along the reaction coordinate, R,, is 36; R, is its reverse,
37. Motion perpendicular to the reaction coordinate is the vibration represented
by 38 and 39; 38 represents a displacement toward the lower left of the diagram
N+tC X+ tN C+X
Motion R1 Motion Rz
36 37
118 See notes 116, 117.