
Page 65 - Mechatronic Systems Modelling and Simulation with HDLs
P. 65
54 3 MODELLING AND SIMULATION OF MIXED SYSTEMS
3.4.2 Block diagrams
Block diagrams are often used in control technology and, like bond graphs, rep-
resent a form of structural modelling, see Cellier [62]. However, this type of
representation primarily shows the structure of equations, whereas the structure of
the system tends to be found indirectly from the structure of the equation system.
Block diagrams include blocks and directional connections between the blocks.
These connections describe signals, which are converted into other signals by
the blocks. In addition there are taps and summing points, so that the important
elements of block diagrams can be fully represented in Figure 3.8.
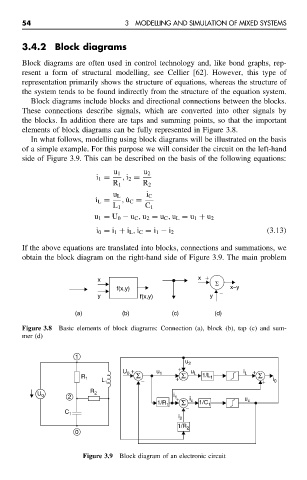
In what follows, modelling using block diagrams will be illustrated on the basis
of a simple example. For this purpose we will consider the circuit on the left-hand
side of Figure 3.9. This can be described on the basis of the following equations:
u 1 u 2
i 1 = , i 2 =
R 1 R 2
u L i C
˙ ı L = , ˙u C =
L 1 C 1
u 1 = U 0 − u C , u 2 = u C , u L = u 1 + u 2
i 0 = i 1 + i L , i C = i 1 − i 2 (3.13)
If the above equations are translated into blocks, connections and summations, we
obtain the block diagram on the right-hand side of Figure 3.9. The main problem
x x +
Σ
f(x,y) x−y
y f(x,y) y −
(a) (b) (c) (d)
Figure 3.8 Basic elements of block diagrams: Connection (a), block (b), tap (c) and sum-
mer (d)
1
u 2
U + u + u i L +
R 1 L 1 0 Σ − 1 + Σ L 1/L 1 Σ + i 0
U 0 2 R 2 i 1
1/R 1 + Σ − i c 1/C 1 u c
C 1
i 2
1/R 2
0
Figure 3.9 Block diagram of an electronic circuit