
Page 232 - Mechatronics for Safety, Security and Dependability in a New Era
P. 232
Ch44-I044963.fm Page 216 Tuesday, August 1, 2006 4:00 PM
Ch44-I044963.fm
216
216 Page 216 Tuesday, August 1, 2006 4:00 PM
worst rule for storages. That means the best rule from view point of total manufacturing system
might not be the best for each area. Conversely, the best rale at an area might not be the global best
rule. It is important to evaluate the global manufacturing system for cutting total product cost. All
costs in assembly line are the same. We consider that the initial inventory level of parts storage is
enough to absorb the fluctuation of parts arrival from processing areas. Those facts also suggest the
importance of evaluating total manufacturing system.
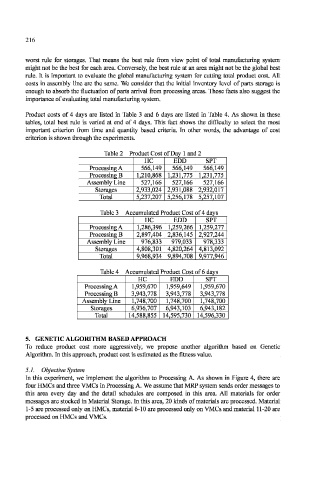
Product costs of 4 days are listed in Table 3 and 6 days are listed in Table 4. As shown in these
tables, total best rule is varied at end of 4 days. This fact shows the difficulty to select the most
important criterion from time and quantity based criteria. In other words, the advantage of cost
criterion is shown through the experiments.
Table 2 Product Cost of Day 1 am 2
HC EDD SPT
Processing A 566,149 566,149 566,149
Processing B 1,210,868 1,231,775 1,231,775
Assembly Line 527,166 527,166 527,166
Storages 2,933,024 2,931,088 2,932,017
Total 5,237,207 5,256,178 5,257,107
Table 3 Accumulated Product Cost of 4 days
HC EDD SPT
Processing A 1,286,396 1,259,266 1,259,277
Processing B 2,897,404 2,836,145 2,927,244
Assembly Line 976,833 979,033 978,333
Storages 4,808,301 4,820,264 4,813,092
Total 9,968,934 9,894,708 9,977,946
Table 4 Accumulated Product Cost of 6 days
HC EDD SPT
Processing A 1,959,670 1,959,649 1,959,670
Processing B 3,943,778 3,943,778 3,943,778
Assembly Line 1,748,700 1,748,700 1,748,700
Storages 6,936,707 6,943,103 6,943,182
Total 14,588,855 14,595,730 14,596,330
5. GENETIC ALGORITHM BASED APPROACH
To reduce product cost more aggressively, we propose another algorithm based on Genetic
Algorithm. In this approach, product cost is estimated as the fitness value.
5. /. Objective System
In this experiment, we implement the algorithm to Processing A. As shown in Figure 4, there are
four HMCs and three VMCs in Processing A. We assume that MRP system sends order messages to
this area every day and the detail schedules are composed in this area. All materials for order
messages are stocked in Material Storage. In this area, 20 kinds of materials are processed. Material
1-5 are processed only on HMCs, material 6-10 are processed only on VMCs and material 11-20 are
processed on HMCs and VMCs.