
Page 233 - Mechatronics for Safety, Security and Dependability in a New Era
P. 233
Ch44-I044963.fm Page 217 Tuesday, August 1, 2006 4:00 PM
Page 217
4:00 PM
Ch44-I044963.fm
Tuesday, August 1, 2006
217
217
HMC2 HMC3 HMC4
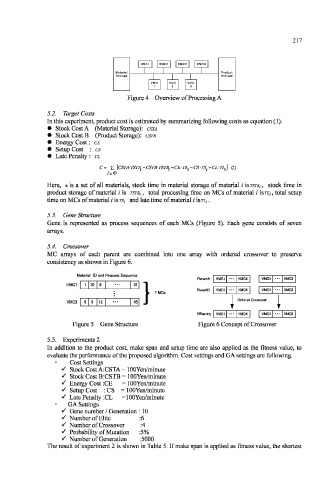
Figure 4 Overview of Processing A
5.2. Target Costs
In this experiment, product cost is estimated by summarizing following costs as equation (1).
• Stock Cost A (Material Storage): CSTA
• Stock Cost B (Product Storage): CSTB
• Energy Cost: CE
• Setup Cost : cs
• Late Penalty : CL
C= I (cSTA-TSTA i+CSTB-TSTB j+CE-TE j+CS-TS l+CL-TL i) (1)
Here, D is a set of all materials, stock time in material storage of material / is TSTAJ , stock time in
product storage of material / is TSTBJ , total processing time on MCs of material / is re f, total setup
time on MCs of material i is re, and late time of material i \STL : .
5.3. Gene Structure
Gene is represented as process sequences of each MCs (Figure 5). Each gene consists of seven
arrays.
5.4. Crossover
MC arrays of each parent are combined into one array with ordered crossover to preserve
consistency as shown in Figure 6.
Material ID and Process Sequence
HMC1 HMC4 VMC1 VMC3
HMC1 1 10 8 31
HMC1 HMC4 VMC1 VMC3
7 MCs
VMC3 6 3 12 45
Offspring HMC1 • • • HMC4 VMC1 • • • VMC3
Figure 5 Gene Structure Figure 6 Concept of Crossover
5.5. Experiments 2
In addition to the product cost, make span and setup time are also applied as the fitness value, to
evaluate the performance of the proposed algorithm. Cost settings and GA settings are following.
Cost Settings
S Stock Cost A:CSTA = lOOYen/minute
^ Stock Cost B:CSTB = lOOYen/minute
•S Energy Cost :CE = lOOYen/minute
^ Setup Cost :CS = lOOYen/minute
S Late Penalty :CL =100Yen/minute
GA Settings
•f Gene number / Generation : 10
•S Number of Elite :6
•S Number of Crossover :4
•S Probability of Mutation :5%
•S Number of Generation :5000
The result of experiment 2 is shown in Table 5. If make span is applied as fitness value, the shortest