Page 331 - Mechatronics for Safety, Security and Dependability in a New Era
P. 331

Ch64-I044963.fm  Page 315  Thursday, July 27, 2006  12:11 PM
                            Thursday, July27, 2006
                                           12:11PM
            Ch64-I044963.fm
                      Page315
                                                                                          315
                                                                                          315
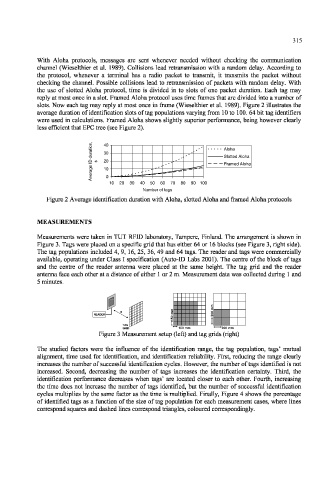
                  With  Aloha  protocols,  messages  are  sent  whenever  needed  without  checking  the  communication
                  channel  (Wieselthier  et  al.  1989). Collisions  lead  retransmission  with  a random  delay.  According  to
                  the  protocol,  whenever  a  terminal  has  a  radio  packet  to  transmit,  it  transmits  the  packet  without
                  checking  the  channel.  Possible  collisions  lead  to retransmission  of packets  with  random  delay.  With
                  the  use  of  slotted  Aloha  protocol,  time  is  divided  in  to  slots  of  one  packet  duration.  Each  tag  may
                  reply at most once in a slot. Framed Aloha protocol uses time frames  that are divided into a number of
                  slots. Now each tag may reply at most  once  in frame  (Wieselthier  et al.  1989). Figure 2 illustrates the
                  average duration of identification  slots of tag populations varying from  10 to  100. 64 bit tag  identifiers
                  were used in calculations. Framed  Aloha  shows  slightly  superior performance,  being however  clearly
                  less efficient  that EPC tree (see Figure 2).


                                 ,
                                 n   40 4
                                 o
                                 i
                                                                      Aloha
                                 t   30 °                             Aloha
                                 a
                                 r
                                 u                                    Slotted Aloha
                                 d                          - *

                                     20
                                 D  s  20
                                                                      Framed Aloha
                                 I                                    Framed Aloha

                                 e                   - - • '
                                 g   10
                                 a                      «  -  =
                                 r
                                 e   0  -  • •  -  -  •  — —
                                 v
                                 A
                                      10  20  30  40  50  60  70  80  90 100
                                                       70
                                                     60
                                                          80
                                                                100
                                                             90
                                         20
                                      10
                                            30
                                                  50
                                               40
                                                Number of tags
                                                Number of tags
                     Figure 2 Average identification  duration with Aloha, slotted Aloha and framed  Aloha protocols
                  MEASUREMENTS
                  Measurements  were  taken  in TUT RFID  laboratory,  Tampere,  Finland.  The arrangement  is  shown  in
                  Figure 3. Tags were placed  on a specific  grid that has either 64 or  16 blocks (see Figure 3, right side).
                  The tag populations  included 4, 9,  16, 25, 36, 49 and 64 tags. The reader and tags were  commercially
                  available,  operating  under Class I specification  (Auto-ID  Labs 2001). The centre  of the block  of tags
                  and  the  centre  of  the  reader  antenna  were  placed  at  the  same  height.  The  tag  grid  and  the  reader
                  antenna  face  each other at a distance  of either  1 or 2 m. Measurement  data was collected  during  1 and
                  5 minutes.
                                                                   m E m
                                                        m
                                         R              m E "      0
                                  READER                           3 i  0
                                                        0
                                                        5
                                                        1          I
                                          TAG
                                                                      300 mm
                                                       l "* 150 mm
                                          GRID            150 mm   • m  m300 n
                                   Figure 3 Measurement  setup (left)  and tag grids (right)
                  The  studied  factors  were  the  influence  of  the  identification  range,  the  tag  population,  tags'  mutual
                  alignment,  time used  for  identification,  and  identification  reliability.  First,  reducing  the range  clearly
                  increases the number of successful  identification  cycles. However, the number of tags identified  is not
                  increased.  Second,  decreasing  the  number  of  tags  increases  the  identification  certainty.  Third,  the
                  identification  performance  decreases  when  tags'  are  located  closer  to  each  other.  Fourth,  increasing
                  the  time  does not  increase  the number  of tags  identified,  but  the number  of  successful  identification
                  cycles multiplies  by the  same  factor  as the time  is multiplied.  Finally, Figure 4  shows the  percentage
                  of identified  tags  as a function  of the  size  of tag population  for  each measurement  cases, where  lines
                  correspond  squares and dashed lines correspond triangles, coloured  correspondingly.
   326   327   328   329   330   331   332   333   334   335   336