
Page 301 - Membranes for Industrial Wastewater Recovery and Re-Use
P. 301
2 70 Mentbranes for lndustrial Wastewater Recovery and Re-use
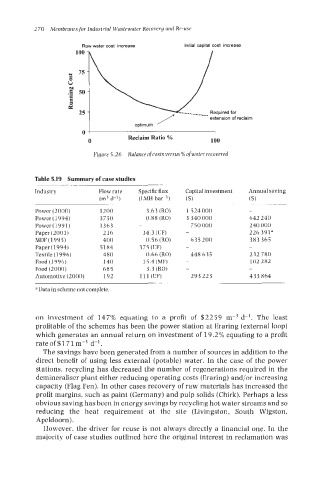
Raw water cost increase Initial caDital cost increase
100
OB
.f 50
z
e
25 -.-.-_ Required for
extension of reclaim
0 I
0 Reclaim Ratio % 100
Figure 5.26 Balance ofcosts versus% of water recovered
Table 5.19 Summary of case studies
Industry Flow rate Specific flux Capital investment Annual saving
(m3 d-l) (LMH bar-’) ($) ($1
Power (2000) 1200 3.63 (RO) 1524000 -
Power(1994) 3750 0.88 (RO) 3 340 000 642 240
Power (1 991) 1363 - 750000 240 000
Paper (2001) 216 34.3 (UF) - 226 391”
MDF(1995) 400 0.56 (RO) 635200 383 365
Paper (1994) 5184 3 7 5 (UF) - -
Textile (1996) 480 0.66 (RO) 448 635 232 780
Food(1996) 140 15.4 (MF) - 102 282
Food (2000) 685 3.3 (RO) - -
Automotive (2000) 192 111 (UF) 293 223 433 864
a Data in scheme not complete.
on investment of 147% equating to a profit of $2259 m-3 d-l. The least
profitable of the schemes has been the power station at Eraring (external loop)
which generates an annual return on investment of 19.2% equating to a profit
rate of $1 71 m-3 d-l.
The savings have been generated from a number of sources in addition to the
direct benefit of using less external (potable) water. In the case of the power
stations, recycling has decreased the number of regenerations required in the
demineraliser plant either reducing operating costs (Eraring) and/or increasing
capacity (Flag Fen). In other cases recovery of raw materials has increased the
profit margins, such as paint (Germany) and pulp solids (Chirk). Perhaps a less
obvious saving has been in energy savings by recycling hot water streams and so
reducing the heat requirement at the site (Livingston, South Wigston,
Apeldoorn).
However, the driver for reuse is not always directly a financial one. In the
majority of case studies outlined here the original interest in reclamation was