
Page 375 - A Practical Guide from Design Planning to Manufacturing
P. 375
Silicon Debug and Test 345
The tester can alter the voltage or timing of inputs on a per pin basis. It
also monitors the voltage and timing of outputs on a per pin basis. Because
there are no system interrupts or other competing applications, a tester pat-
tern is expected to run in exactly the same way every time, while tests of
platforms supporting peripherals and an operating system will always
have some variation. Most importantly, ATEs have full access to all the die’s
DFT circuits where a validation platform may not. By being precisely
repeatable and eliminating possible bugs due to the operating system or
other hardware components, ATEs provide the ultimate test of whether a
bug is due to a processor design flaw or not.
The first task of silicon debug is reproducing bugs found in validation
platforms on the tester. This means finding the shortest pattern possi-
ble, which will still trigger the bug. What parts of the tester pattern can
be removed without eliminating the failure gives clues about the pos-
sible causes of the bug. DFT circuits also provide a great deal of infor-
mation. Debug engineers will look at values from the scan chain, at the
results of array dumps, and may program BIST circuits to perform fur-
ther tests. These results are often enough to determine the root cause
of a bug, but for more difficult bugs more information may be needed.
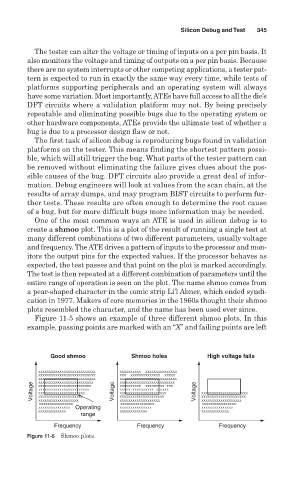
One of the most common ways an ATE is used in silicon debug is to
create a shmoo plot. This is a plot of the result of running a single test at
many different combinations of two different parameters, usually voltage
and frequency. The ATE drives a pattern of inputs to the processor and mon-
itors the output pins for the expected values. If the processor behaves as
expected, the test passes and that point on the plot is marked accordingly.
The test is then repeated at a different combination of parameters until the
entire range of operation is seen on the plot. The name shmoo comes from
a pear-shaped character in the comic strip Li’l Abner, which ended syndi-
cation in 1977. Makers of core memories in the 1960s thought their shmoo
plots resembled the character, and the name has been used ever since.
Figure 11-5 shows an example of three different shmoo plots. In this
example, passing points are marked with an “X” and failing points are left
Good shmoo Shmoo holes High voltage fails
Voltage Voltage Voltage
Operating
range
Frequency Frequency Frequency
Figure 11-5 Shmoo plots.