Page 279 - Microtectonics
P. 279

272   10  ·  Special Techniques
                                                                   EBSD is a very powerful method to investigate microstruc-
                                                                ture in rocks, and presently more popular than EC patterns
                                                                since resolution is higher and patterns are easier to deter-
                                                                mine (×Photo 10.3a–e). The interpretation of the diffraction
                                                                patterns through indexing of lines in the diffraction patterns
                                                                is now highly automatised and can be carried out by a number
                                                                of computer programs (Fig. 10.8c, ×Photo 10.3d,e).
                                                                   Combinations of atomic number contrast, OC and
                                                                EBSD-pattern information for a sample provide a power-
                                                                ful tool in microtectonics. It is standard practice to make
                                                                atomic number contrast and OC images of a microstruc-
                                                                ture, and then select a large number of points where EBSD
                                                                patterns are determined and translated into orientation
                                                                data. In this way, the complete crystallographic preferred
                                                                orientation of a microstructure can be obtained quickly,
                                                                and linked to a spatial image (×Photo 10.3a–e). A useful
                                                                way to present such data is through a grain boundary
                                                                misorientation map, where grain boundaries are marked
                                                                by the angle of misorientation separating neighbouring
                                                                grains and subgrains (Trimby and Prior 1999). Attempts
                                                                are being made to automatise the process completely, to
                                                                make complete maps of the atomic number contrast and
                                                                the orientation of the material over a fine, regular grid.

                                                                10.2.4.4
                                                                Sample Preparation

                                                                Samples used in the SEM are studied under vacuum, and
                                                                should therefore be dry. This is no problem with most
                                                                rock samples, but clay samples may have to be dried be-
                                                                fore use. One specific problem of the SEM is that the elec-
                                                                tron beam, which hits the specimen, tends to cause local
                                                                electrostatic charging which can cause beam deflection,
                                                                thereby distorting the image. It is therefore necessary that
                                                                samples are conductive. This is a problem in most rock
                                                                samples, which have to be coated with a thin conductive
                                                                layer of a metal such as gold (secondary electron-mode
                                                                images) or carbon (back-scatter electron-mode images).


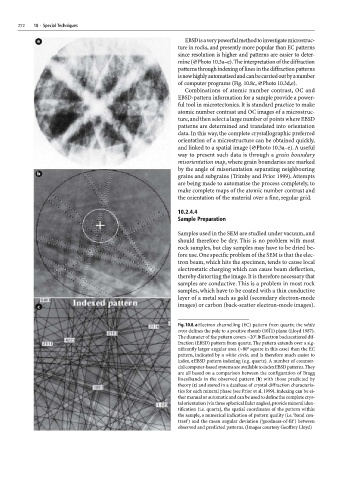
                                                                Fig. 10.8. a Electron channelling (EC) pattern from quartz; the white
                                                                cross defines the pole to a positive rhomb (1011) plane (Lloyd 1987).
                                                                The diameter of the pattern covers ~20°. b Electron backscattered dif-
                                                                fraction (EBSD) pattern from quartz. The pattern extends over a sig-
                                                                nificantly larger angular area (~80° square in this case) than the EC
                                                                pattern, indicated by a white circle, and is therefore much easier to
                                                                index. c EBSD pattern indexing (e.g. quartz). A number of commer-
                                                                cial computer-based systems are available to index EBSD patterns. They
                                                                are all based on a comparison between the configuration of Bragg
                                                                lines/bands in the observed pattern (b) with those predicted by
                                                                theory (c) and stored in a database of crystal diffraction characteris-
                                                                tics for each mineral phase (see Prior et al. 1999). Indexing can be ei-
                                                                ther manual or automatic and can be used to define the complete crys-
                                                                tal orientation (via three spherical Euler angles), provide mineral iden-
                                                                tification (i.e. quartz), the spatial coordinates of the pattern within
                                                                the sample, a numerical indication of pattern quality (i.e. ‘band con-
                                                                trast’) and the mean angular deviation (‘goodness-of-fit’) between
                                                                observed and predicted patterns. (Images courtesy Geoffrey Lloyd)
   274   275   276   277   278   279   280   281   282   283   284