
Page 274 - Microtectonics
P. 274
10.2 · Techniques to Study Deformation Fabrics 267
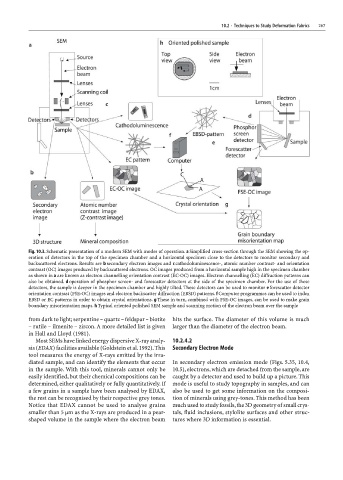
Fig. 10.3. Schematic presentation of a modern SEM with modes of operation. a Simplified cross-section through the SEM showing the op-
eration of detectors in the top of the specimen chamber and a horizontal specimen close to the detectors to monitor secondary and
backscattered electrons. Results are b secondary electron images and c cathodoluminescence-, atomic number contrast- and orientation
contrast (OC) images produced by backscattered electrons. OC images produced from a horizontal sample high in the specimen chamber
as shown in a are known as electron channelling orientation contrast (EC-OC) images. Electron channelling (EC) diffraction patterns can
also be obtained. d operation of phosphor screen- and forescatter detectors at the side of the specimen chamber. For the use of these
detectors, the sample is deeper in the specimen chamber and highly tilted. These detectors can be used to monitor e forescatter detector
orientation contrast (FSE-OC) images and electron backscatter diffraction (EBSD) patterns. f Computer programmes can be used to index
EBSD or EC patterns in order to obtain crystal orientations. g These in turn, combined with FSE-OC images, can be used to make grain
boundary misorientation maps. h Typical oriented polished SEM sample and scanning motion of the electron beam over the sample
from dark to light; serpentine – quartz – feldspar – biotite hits the surface. The diameter of this volume is much
– rutile – ilmenite – zircon. A more detailed list is given larger than the diameter of the electron beam.
in Hall and Lloyd (1981).
Most SEMs have linked energy dispersive X-ray analy- 10.2.4.2
sis (EDAX) facilities available (Goldstein et al. 1992). This Secondary Electron Mode
tool measures the energy of X-rays emitted by the irra-
diated sample, and can identify the elements that occur In secondary electron emission mode (Figs. 5.35, 10.4,
in the sample. With this tool, minerals cannot only be 10.5), electrons, which are detached from the sample, are
easily identified, but their chemical compositions can be caught by a detector and used to build up a picture. This
determined, either qualitatively or fully quantitatively. If mode is useful to study topography in samples, and can
a few grains in a sample have been analysed by EDAX, also be used to get some information on the composi-
the rest can be recognised by their respective grey tones. tion of minerals using grey-tones. This method has been
Notice that EDAX cannot be used to analyse grains much used to study fossils, the 3D geometry of small crys-
smaller than 5 µm as the X-rays are produced in a pear- tals, fluid inclusions, stylolite surfaces and other struc-
shaped volume in the sample where the electron beam tures where 3D information is essential.