
Page 271 - Microtectonics
P. 271
264 10 · Special Techniques
10.1 10.1 10.2
Introduction Techniques to Study Deformation Fabrics
The study of microstructures in thin section can give a 10.2.1
lot of information for thematic and tectonic studies but Cathodoluminescence
has its limitations. In many cases, additional informa-
tion has to be gathered by other techniques. In this chap- Many minerals show luminescence when being excited
ter we wish to give the reader an outline of some other with a beam of electrons. The impact of a primary elec-
analytical laboratory techniques that use minerals in their tron beam on a sample causes processes like backscatter-
original arrangement in the rock, similar to that in a thin ing of electrons, energy transfer to the lattice resulting
section, excluding techniques that use powdered or dis- in local heating, and the generation of X-rays and sec-
solved rocks or minerals for analysis. Analysis may con- ondary electrons. The latter are low enough in energy to
cern the fabric, the arrangement of minerals in the rock, transfer electrons of lattice ions to an excited energetic
the mineral chemistry and isotope composition, fluid state. The return of ions from the excited to the basic
inclusions, age of minerals and parts of minerals and lat- state may cause a portion of the initial energy to be emit-
tice preferred orientation. We only discuss methods that ted as light photons in the visible range of the electro-
study minerals in their original arrangement in the rock. magnetic spectrum (Figs. 5.1b, 10.1, 10.9a). Because elec-
We indicate what problems can be studied by these tech- tron beams are commonly produced in cathodes, this
niques, which type of materials can be studied and what type of electron beam-induced luminescence is referred
type of sample is needed, and, finally, what the limita- to as cathodoluminescence (CL). One characteristic of CL
tions of the different techniques are. The aim is to allow is that the excited location and the location from which
the reader to assess whether other techniques can help the CL is emitted may be several micrometres apart. As a
him to solve his problem and, if so, what material has to result, CL images commonly have a somewhat blurred
be prepared. or “out-of-focus” appearance when compared with
backscattered electron images (Sect. 10.2.4.3).
The CL signal emitted by an excited mineral is mostly
Finally a warning: it is not difficult to obtain data
complex in nature. The emission can be related to the min-
using unfamiliar techniques, but it is difficult to in-
eral structure itself and this type of CL is mostly in the ul-
terpret the reliability of such data in any specific
geological setting. traviolet part of the spectrum. However, CL of many rock-
forming minerals is mainly controlled by the presence of
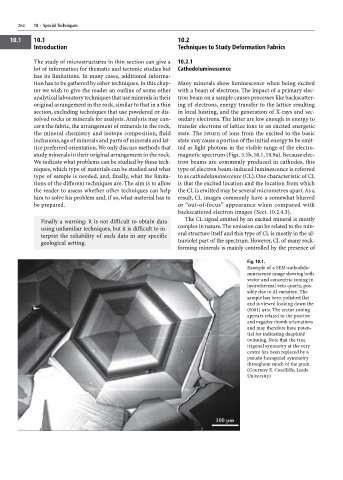
Fig. 10.1.
Example of a SEM-cathodolu-
minescence image showing both
sector and concentric zoning in
hydrothermal vein quartz, pos-
sibly due to Al variation. The
sample has been polished flat
and is viewed looking down the
(0001) axis. The sector zoning
appears related to the positive
and negative rhomb orientations
and may therefore have poten-
tial for indicating dauphiné
twinning. Note that the true
trigonal symmetry at the very
centre has been replaced by a
pseudo-hexagonal symmetry
throughout much of the grain.
(Courtesy E. Condliffe, Leeds
University)