
Page 273 - Microtectonics
P. 273
266 10 · Special Techniques
10.2.3
Electron Microscopy – Introduction
At magnifications exceeding 1000 ×, objects seen by the
optical microscope become fuzzy. This is a direct conse-
quence of the use of light as a medium to transport in-
formation; the wavelength of visible light varies from 400
to 750 nm and no objects smaller than 100 nm can be
observed. Depending on their velocity, electrons have
much smaller wavelengths and can therefore be used to
carry information about smaller objects. Two types of
electron microscope are commonly used in geology; the
scanning electron microscope (SEM), and the transmis-
sion electron microscope (TEM).
10.2.4
Scanning Electron Microscopy (SEM)
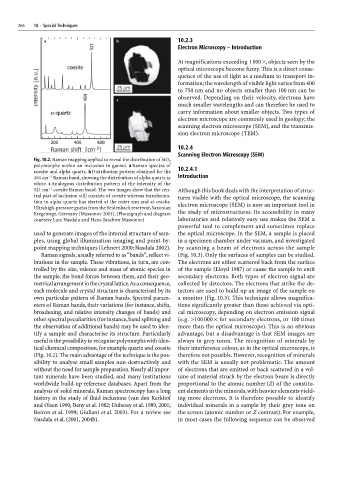
Fig. 10.2. Raman mapping applied to reveal the distribution of SiO 2
polymorphs within an inclusion in garnet. a Raman spectra of
coesite and alpha quartz. b Distribution pattern obtained for the 10.2.4.1
–1
464 cm Raman band, showing the distribution of alpha quartz in Introduction
white. c Analogous distribution pattern of the intensity of the
–1
521 cm coesite Raman band. The two images show that the cen- Although this book deals with the interpretation of struc-
tral part of inclusion still consists of coesite whereas transforma- tures visible with the optical microscope, the scanning
tion to alpha quartz has started at the outer rim and at cracks. electron microscope (SEM) is now an important tool in
Ultrahigh-pressure gneiss from the Seidenbach reservoir, Saxonian
Erzgebirge, Germany (Massonne 2001). (Photograph and diagram the study of microstructures. Its accessibility in many
courtesy Lutz Nasdala and Hans-Joachim Massonne) laboratories and relatively easy use makes the SEM a
powerful tool to complement and sometimes replace
used to generate images of the internal structure of sam- the optical microscope. In the SEM, a sample is placed
ples, using global illumination imaging and point-by- in a specimen chamber under vacuum, and investigated
point mapping techniques (Lehnert 2000; Nasdala 2002). by scanning a beam of electrons across the sample
Raman signals, usually referred to as “bands”, reflect vi- (Fig. 10.3). Only the surfaces of samples can be studied.
brations in the sample. These vibrations, in turn, are con- The electrons are either scattered back from the surface
trolled by the size, valence and mass of atomic species in of the sample (Lloyd 1987) or cause the sample to emit
the sample, the bond forces between them, and their geo- secondary electrons. Both types of electron signal are
metrical arrangement in the crystal lattice. As a consequence, collected by detectors. The electrons that strike the de-
each molecule and crystal structure is characterised by its tectors are used to build up an image of the sample on
own particular pattern of Raman bands. Spectral param- a monitor (Fig. 10.3). This technique allows magnifica-
eters of Raman bands, their variations (for instance, shifts, tions significantly greater than those achieved via opti-
broadening, and relative intensity changes of bands) and cal microscopy, depending on electron emission signal
other spectral peculiarities (for instance, band splitting and (e.g. >100 000 × for secondary electrons, or 100 times
the observation of additional bands) may be used to iden- more than the optical microscope). This is an obvious
tify a sample and characterise its structure. Particularly advantage, but a disadvantage is that SEM images are
useful is the possibility to recognise polymorphs with iden- always in grey tones. The recognition of minerals by
tical chemical composition, for example quartz and coesite their interference colour, as in the optical microscope, is
(Fig. 10.2). The main advantage of the technique is the pos- therefore not possible. However, recognition of minerals
sibility to analyse small samples non-destructively and with the SEM is usually not problematic. The amount
without the need for sample preparation. Nearly all impor- of electrons that are emitted or back scattered in a vol-
tant minerals have been studied, and many institutions ume of material struck by the electron beam is directly
worldwide build-up reference databases. Apart from the proportional to the atomic number (Z) of the constitu-
analysis of solid minerals, Raman spectroscopy has a long ent elements in the minerals, with heavier elements yield-
history in the study of fluid inclusions (van den Kerkhof ing more electrons. It is therefore possible to identify
and Olsen 1990; Beny et al. 1982; Dubessy et al. 1989, 2001; individual minerals in a sample by their grey tone on
Boiron et al. 1999; Giuliani et al. 2003). For a review see the screen (atomic number or Z contrast). For example,
Nasdala et al. (2001, 2004b). in most cases the following sequence can be observed