
Page 156 - MODELING OF ASPHALT CONCRETE
P. 156
134 Cha pte r F i v e
this requirement is not a problem in the axial compression test geometry. However, in
the IDT tests with a 50.8-mm gauge length, this requirement is satisfied for the 9.5- and
12.5-mm mixes, but not for the 19.0- and 25.0-mm mixes, resulting in a higher variability
among replicates and a higher percent difference in the 19.0- and 25.0-mm mixes.
Another observation made from a detailed data analysis is that, in some replicates
of the 25.0-mm mix, a significant difference was found between displacements from the
front and back surfaces of the IDT specimens. These observations suggest that the
positions of large aggregate particles within the gauge length affect the data, and that a
larger gauge length is required for 25.0-mm mixes.
The visual observation of the average mastercurves in Figs. 5-4 to 5-6 and further
statistical analysis suggest that the dynamic modulus determined from the IDT test
using the linear viscoelastic solution in Eq. (5-26) is statistically the same as the one
measured from the axial compression test. A question may arise regarding why the
effect of different relationships between the compaction direction and the direction in
which the stress-strain analysis is performed in the axial compression and the IDT tests
seems to be insignificant. This difference and possibly anisotropy may exist when the
axial compression cylinders and the IDT specimens are compared. However, due to
very small strain levels used in these tests (50 to 80 microstrains), the dynamic modulus
test more or less “tickles” the mastic and does not fully capture the effect of these
differences that are mostly related to the large aggregate orientation.
Comparison of Phase Angles
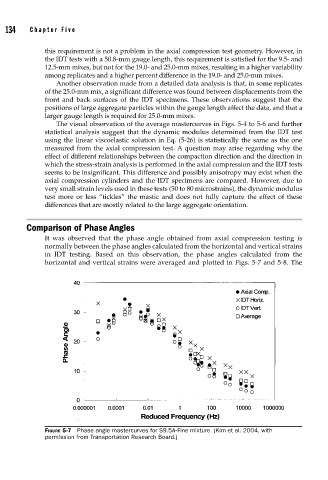
It was observed that the phase angle obtained from axial compression testing is
normally between the phase angles calculated from the horizontal and vertical strains
in IDT testing. Based on this observation, the phase angles calculated from the
horizontal and vertical strains were averaged and plotted in Figs. 5-7 and 5-8. The
FIGURE 5-7 Phase angle mastercurves for S9.5A-Fine mixture. (Kim et al. 2004, with
permission from Transportation Research Board.)