
Page 155 - MODELING OF ASPHALT CONCRETE
P. 155
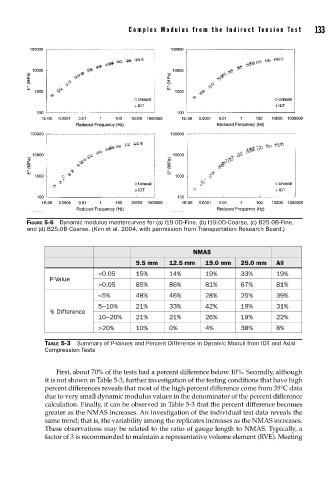
Complex Modulus fr om the Indir ect Tension Test    133


               FIGURE 5-6  Dynamic modulus mastercurves for (a) I19.0D-Fine, (b) I19.0D-Coarse, (c) B25.0B-Fine,
               and (d) B25.0B-Coarse. (Kim et al. 2004, with permission from Transportation Research Board.)


                                                              NMAS
                                              9.5 mm   12.5 mm   19.0 mm   25.0 mm   All
                                   <0.05      15%      14%       19%       33%       19%
                      P-Value
                                   >0.05      85%      86%       81%       67%       81%
                                   <5%        48%      46%       28%       25%       39%
                                   5−10%      21%      33%       42%       19%       31%
                      % Difference
                                   10−20%     21%      21%       26%       19%       22%
                                   >20%       10%      0%        4%        38%       8%

                    TABLE 5-3  Summary of P-Values and Percent Difference in Dynamic Moduli from IDT and Axial
                    Compression Tests


                       First, about 70% of the tests had a percent difference below 10%. Secondly, although
                    it is not shown in Table 5-3, further investigation of the testing conditions that have high
                    percent differences reveals that most of the high percent difference come from 35°C data
                    due to very small dynamic modulus values in the denominator of the percent difference
                    calculation. Finally, it can be observed in Table 5-3 that the percent difference becomes
                    greater as the NMAS increases. An investigation of the individual test data reveals the
                    same trend; that is, the variability among the replicates increases as the NMAS increases.
                    These observations may be related to the ratio of gauge length to NMAS. Typically, a
                    factor of 3 is recommended to maintain a representative volume element (RVE). Meeting