
Page 152 - MODELING OF ASPHALT CONCRETE
P. 152
130 Cha pte r F i v e
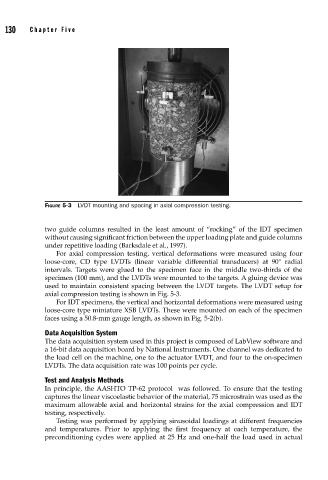
FIGURE 5-3 LVDT mounting and spacing in axial compression testing.
two guide columns resulted in the least amount of “rocking” of the IDT specimen
without causing significant friction between the upper loading plate and guide columns
under repetitive loading (Barksdale et al., 1997).
For axial compression testing, vertical deformations were measured using four
loose-core, CD type LVDTs (linear variable differential transducers) at 90° radial
intervals. Targets were glued to the specimen face in the middle two-thirds of the
specimen (100 mm), and the LVDTs were mounted to the targets. A gluing device was
used to maintain consistent spacing between the LVDT targets. The LVDT setup for
axial compression testing is shown in Fig. 5-3.
For IDT specimens, the vertical and horizontal deformations were measured using
loose-core type miniature XSB LVDTs. These were mounted on each of the specimen
faces using a 50.8-mm gauge length, as shown in Fig. 5-2(b).
Data Acquisition System
The data acquisition system used in this project is composed of LabView software and
a 16-bit data acquisition board by National Instruments. One channel was dedicated to
the load cell on the machine, one to the actuator LVDT, and four to the on-specimen
LVDTs. The data acquisition rate was 100 points per cycle.
Test and Analysis Methods
In principle, the AASHTO TP-62 protocol was followed. To ensure that the testing
captures the linear viscoelastic behavior of the material, 75 microstrain was used as the
maximum allowable axial and horizontal strains for the axial compression and IDT
testing, respectively.
Testing was performed by applying sinusoidal loadings at different frequencies
and temperatures. Prior to applying the first frequency at each temperature, the
preconditioning cycles were applied at 25 Hz and one-half the load used in actual