
Page 188 - MODELING OF ASPHALT CONCRETE
P. 188
166 Cha pte r Se v e n
time is converted to reduced time with the time-temperature shift factors from LVE
characterization (e.g., frequency and temperature sweep dynamic modulus tests) and
plotted with the respective stress. If the resulting graph, for a wide range of strain levels,
appears continuous, then TTS with growing damage is said to be verified. Details on
the theoretical background of this technique can be found in Chehab et al. (2002).
Chehab et al. (2002) demonstrated that the TRS behavior extends well beyond the
LVE limits to highly damaged levels for asphalt concrete in tension. Underwood et al.
(2006b) proved that TTS with growing damage is valid for various modified asphalt
mixtures. Other researchers (Zhao 2002; Gibson et al. 2003; Kim et al. 2005) also found
that asphalt concrete in compression is TRS at high strain levels with damage.
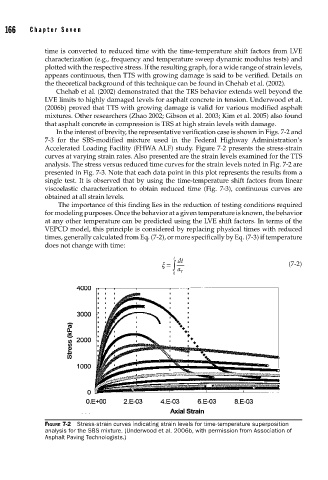
In the interest of brevity, the representative verification case is shown in Figs. 7-2 and
7-3 for the SBS-modified mixture used in the Federal Highway Administration’s
Accelerated Loading Facility (FHWA ALF) study. Figure 7-2 presents the stress-strain
curves at varying strain rates. Also presented are the strain levels examined for the TTS
analysis. The stress versus reduced time curves for the strain levels noted in Fig. 7-2 are
presented in Fig. 7-3. Note that each data point in this plot represents the results from a
single test. It is observed that by using the time-temperature shift factors from linear
viscoelastic characterization to obtain reduced time (Fig. 7-3), continuous curves are
obtained at all strain levels.
The importance of this finding lies in the reduction of testing conditions required
for modeling purposes. Once the behavior at a given temperature is known, the behavior
at any other temperature can be predicted using the LVE shift factors. In terms of the
VEPCD model, this principle is considered by replacing physical times with reduced
times, generally calculated from Eq. (7-2), or more specifically by Eq. (7-3) if temperature
does not change with time:
t
ξ = ∫ dt (7-2)
0 a T
FIGURE 7-2 Stress-strain curves indicating strain levels for time-temperature superposition
analysis for the SBS mixture. (Underwood et al. 2006b, with permission from Association of
Asphalt Paving Technologists.)