
Page 525 - Modelling in Transport Phenomena A Conceptual Approach
P. 525
A.6. REGRESSION AND CORRELATION 505
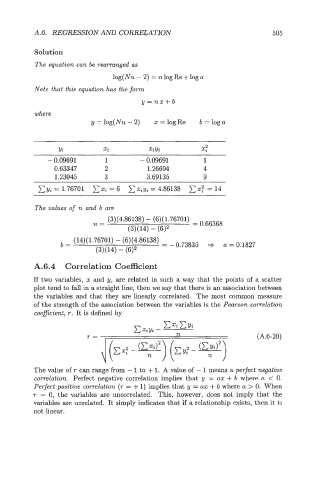
Solution
The equation can be rearranged as
log( Nu - 2) = n log Re + log a
Note that this equation has the form
y=nx+b
where
y = log(Nu - 2) x = logRe b = loga
Yi xi XiYi X?
- 0.09691 1 - 0.09691 1
0.63347 2 1.26694 4
1.23045 3 3.69135 9
= 1.76701 xi = 6 XX~Y~ X? = 14
4.86138
=
The values of n and b are
(14)(1.76701) - (6)(4.86138)
b= = -0.73835 =$ a = 0.1827
(3)(14) - (GI2
A.6.4 Correlation Coefficient
If two variables, x and y, are related in such a way that the points of a scatter
plot tend to fall in a straight line, then we say that there is an association between
the variables and that they are linearly correlated. The most common measure
of the strength of the association between the variables is the Pearson correlation
coeficient, r. It is defined by
The value of r can range from - 1 to + 1. A value of - 1 means a perfect negative
correlation. Perfect negative correlation implies that y = ax + b where a < 0.
Perfect positive correlation (r = + 1) implies that y = ax + b where a > 0. When
r = 0, the variables are uncorrelated. This, however, does not imply that the
variables are unrelated. It simply indicates that if a relationship exists, then it is
not linear.