
Page 127 - Modern Analytical Chemistry
P. 127
1400-CH05 9/8/99 3:59 PM Page 110
110 Modern Analytical Chemistry
either case, the calibration curve provides a means for relating S samp to the ana-
lyte’s concentration.
5
EXAMPLE .3
Colorplate 1 shows an example of a set of A second spectrophotometric method for the quantitative determination of
2+
external standards and their corresponding Pb levels in blood gives a linear normal calibration curve for which
normal calibration curve.
–1
S stand = (0.296 ppb ) ´C S + 0.003
2+
What is the Pb level (in ppb) in a sample of blood if S samp is 0.397?
SOLUTION
To determine the concentration of Pb 2+ in the sample of blood, we replace
S stand in the calibration equation with S samp and solve for C A
S samp –. 0 003 . 0 397 – . 0 003
C A = = = . 133 ppb
. 0 296 ppb –1 . 0 296 ppb –1
It is worth noting that the calibration equation in this problem includes an
extra term that is not in equation 5.3. Ideally, we expect the calibration curve to
give a signal of zero when C S is zero. This is the purpose of using a reagent
blank to correct the measured signal. The extra term of +0.003 in our
calibration equation results from uncertainty in measuring the signal for the
reagent blank and the standards.
An external standardization allows a related series of samples to be ana-
lyzed using a single calibration curve. This is an important advantage in labo-
Calibration curve obtained ratories where many samples are to be analyzed or when the need for a rapid
in standard’s matrix throughput of samples is critical. Not surprisingly, many of the most com-
monly encountered quantitative analytical methods are based on an external
Calibration curve obtained standardization.
in sample’s matrix
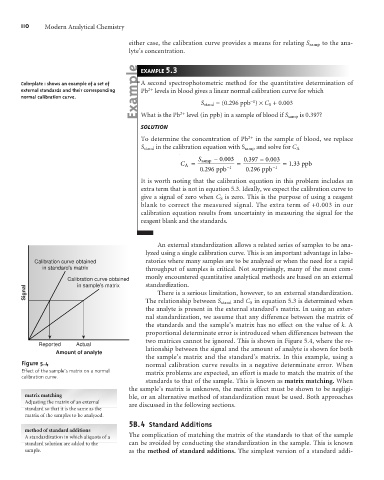
Signal There is a serious limitation, however, to an external standardization.
The relationship between S stand and C S in equation 5.3 is determined when
the analyte is present in the external standard’s matrix. In using an exter-
nal standardization, we assume that any difference between the matrix of
the standards and the sample’s matrix has no effect on the value of k. A
proportional determinate error is introduced when differences between the
two matrices cannot be ignored. This is shown in Figure 5.4, where the re-
Reported Actual
lationship between the signal and the amount of analyte is shown for both
Amount of analyte
the sample’s matrix and the standard’s matrix. In this example, using a
Figure 5.4 normal calibration curve results in a negative determinate error. When
Effect of the sample’s matrix on a normal matrix problems are expected, an effort is made to match the matrix of the
calibration curve.
standards to that of the sample. This is known as matrix matching. When
the sample’s matrix is unknown, the matrix effect must be shown to be negligi-
matrix matching ble, or an alternative method of standardization must be used. Both approaches
Adjusting the matrix of an external are discussed in the following sections.
standard so that it is the same as the
matrix of the samples to be analyzed.
5 4 Standard Additions
B.
method of standard additions
The complication of matching the matrix of the standards to that of the sample
A standardization in which aliquots of a
standard solution are added to the can be avoided by conducting the standardization in the sample. This is known
sample. as the method of standard additions. The simplest version of a standard addi-