Page 131 - Modern Analytical Chemistry
P. 131

1400-CH05  9/8/99  3:59 PM  Page 114


              114    Modern Analytical Chemistry


                                                            S spiked


                                                                                         kC S
                                                                                   Slope =
                                                                                         V f
                                                       –C V
                                                          A o
                                              x-intercept =                       kC V
                                                         C S            y-intercept =  A o
                                                                                   V f
                                                                            V S
                                              (a)


                                                            S spiked


                                                                                   Slope = k

                                                       –C V
                                                          A o
                                              x-intercept =                       kC V
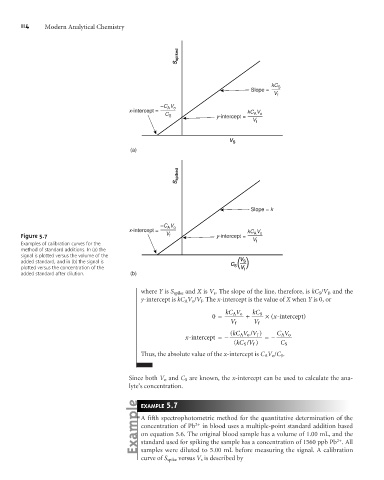
              Figure 5.7                                 V f            y-intercept =  A o
                                                                                   V
              Examples of calibration curves for the                                f
              method of standard additions. In (a) the
              signal is plotted versus the volume of the
                                                                               V
                                                                                S
              added standard, and in (b) the signal is                      C S(  )
              plotted versus the concentration of the                          V f
              added standard after dilution.  (b)
                                                  where Y is S spike and X is V s . The slope of the line, therefore, is kC S /V f , and the
                                                  y-intercept is kC A V o /V f . The x-intercept is the value of X when Y is 0, or
                                                                           kC V    kC S
                                                                             Ao
                                                                       0 =       +      ´x-intercept)
                                                                                         (
                                                                            V f    V f
                                                                            ( kC V V f )  CV
                                                                               Ao /
                                                                                            Ao
                                                               x-intercept  = –        =–
                                                                                S /
                                                                             ( kC V f )    C S
                                                  Thus, the absolute value of the x-intercept is C A V o /C S .
                                              Since both V o and C S are known, the x-intercept can be used to calculate the ana-
                                              lyte’s concentration.

                                                  EXAMPLE .7
                                                         5
                                                  A fifth spectrophotometric method for the quantitative determination of the
                                                  concentration of Pb 2+  in blood uses a multiple-point standard addition based
                                                  on equation 5.6. The original blood sample has a volume of 1.00 mL, and the
                                                                                                            2+
                                                  standard used for spiking the sample has a concentration of 1560 ppb Pb . All
                                                  samples were diluted to 5.00 mL before measuring the signal. A calibration
                                                  curve of S spike versus V s is described by
   126   127   128   129   130   131   132   133   134   135   136