
Page 134 - Modern Analytical Chemistry
P. 134
1400-CH05 9/8/99 3:59 PM Page 117
Chapter 5 Calibrations, Standardizations, and Blank Corrections 117
A single-point internal standardization has the same limitations as a single-
point normal calibration. To construct an internal standard calibration curve, it is
necessary to prepare several standards containing different concentrations of ana-
lyte. These standards are usually prepared such that the internal standard’s concen-
tration is constant. Under these conditions a calibration curve of (S A /S IS ) stand versus
C A is linear with a slope of K/C IS .
5
EXAMPLE .9
A seventh spectrophotometric method for the quantitative determination of
2+
Pb levels in blood gives a linear internal standards calibration curve for which
æ S A ö –1
2
0
ç ÷ = (.11 ppb ) ´ C A – .006
è S IS ø stand
2+
What is the concentration (in ppb) of Pb in a sample of blood if (S A /S IS ) samp is 2.80?
SOLUTION
To determine the concentration of Pb 2+ in the sample of blood, we replace
(S A /S IS ) stand in the calibration equation with (S A /S IS ) samp and solve for C A
/
( SS IS samp + . 0 006 . 2 80 + . 0 006
)
A
C A = –1 = –1 = . 133 ppb
. 211 ppb . 211 ppb
2+
The concentration of Pb in the sample of blood is 1.33 ppb.
When the internal standard’s concentration cannot be held constant the data must
be plotted as (S A /S IS ) stand versus C A /C IS , giving a linear calibration curve with a slope
of K.
5 C Linear Regression and Calibration Curves
In a single-point external standardization, we first determine the value of k by
measuring the signal for a single standard containing a known concentration of
analyte. This value of k and the signal for the sample are then used to calculate
the concentration of analyte in the sample (see Example 5.2). With only a single
determination of k, a quantitative analysis using a single-point external stan-
dardization is straightforward. This is also true for a single-point standard addi-
tion (see Examples 5.4 and 5.5) and a single-point internal standardization (see
Example 5.8).
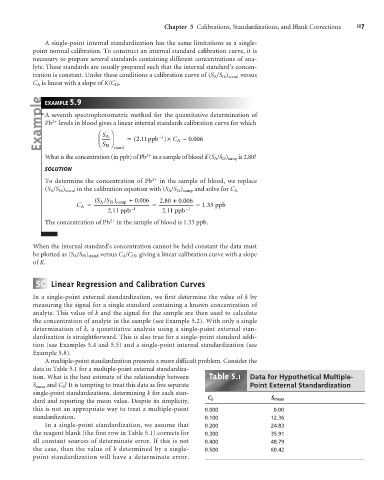
A multiple-point standardization presents a more difficult problem. Consider the
data in Table 5.1 for a multiple-point external standardiza-
5
tion. What is the best estimate of the relationship between Table .1 Data for Hypothetical Multiple-
S meas and C S ? It is tempting to treat this data as five separate Point External Standardization
single-point standardizations, determining k for each stan-
dard and reporting the mean value. Despite its simplicity, C S S meas
this is not an appropriate way to treat a multiple-point 0.000 0.00
standardization. 0.100 12.36
In a single-point standardization, we assume that 0.200 24.83
the reagent blank (the first row in Table 5.1) corrects for 0.300 35.91
all constant sources of determinate error. If this is not 0.400 48.79
the case, then the value of k determined by a single- 0.500 60.42
point standardization will have a determinate error.