Page 130 - Modern Analytical Chemistry
P. 130

1400-CH05  9/8/99  3:59 PM  Page 113


                                                         Chapter 5 Calibrations, Standardizations, and Blank Corrections  113

                                S samp              S spike
                                     =                                            5.9
                                         A [
                                                          [
                                                            /
                                                             (
                                                                  V s
                                     C A  C V o /( V o + V s )]  + C V V o + )]
                                                           s
                                                         S
                            5
                     EXAMPLE  .5
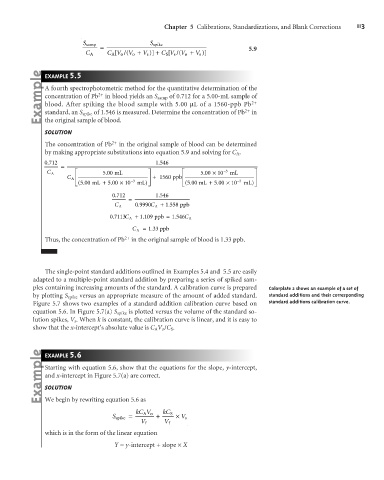
                     A fourth spectrophotometric method for the quantitative determination of the
                     concentration of Pb 2+  in blood yields an S samp of 0.712 for a 5.00-mL sample of
                     blood. After spiking the blood sample with 5.00 mL of a 1560-ppb Pb 2+
                                                                                 2+
                     standard, an S spike of 1.546 is measured. Determine the concentration of Pb in
                     the original sample of blood.
                     SOLUTION
                     The concentration of Pb 2+  in the original sample of blood can be determined
                     by making appropriate substitutions into equation 5.9 and solving for C A .
                                                       .
                     0 712                            1 546
                      .
                          =
                              é                     ù         é            3 –      ù
                                       .
                                                                    .
                     C A              500 mL                       500 ´ 10   mL
                           C A ê                    ú +  1560 ppb ê                 ú
                                               –3
                                                                               3 –
                                         .
                               500 mL +
                              ë (.      5 00 ´10  mL) û       ë (5.00 mL + 5.00  ´ 10  mL) û
                                          .
                                         0 712        1 546
                                                       .
                                              =
                                                 .
                                                0 9990C A + 1 558 ppb
                                                          .
                                          C A

                                         .
                                                            .
                                        0 7113C A + 1 109 ppb = 1 546C A
                                                  .
                                                     .
                                               C A = 133 ppb
                                             2+
                     Thus, the concentration of Pb in the original sample of blood is 1.33 ppb.
                     The single-point standard additions outlined in Examples 5.4 and  5.5 are easily
                 adapted to a multiple-point standard addition by preparing a series of spiked sam-
                 ples containing increasing amounts of the standard. A calibration curve is prepared  Colorplate 2 shows an example of a set of
                 by plotting S spike versus an appropriate measure of the amount of added standard.  standard additions and their corresponding
                 Figure 5.7 shows two examples of a standard addition calibration curve based on  standard additions calibration curve.
                 equation 5.6. In Figure 5.7(a) S spike is plotted versus the volume of the standard so-
                 lution spikes, V s . When k is constant, the calibration curve is linear, and it is easy to
                 show that the x-intercept’s absolute value is C A V o /C S .
                            5
                     EXAMPLE  .6
                     Starting with equation 5.6, show that the equations for the slope, y-intercept,
                     and x-intercept in Figure 5.7(a) are correct.
                     SOLUTION
                     We begin by rewriting equation 5.6 as

                                                kC V    kC S
                                                  Ao
                                         S spike =     +     ´ V s
                                                  V f    V f
                     which is in the form of the linear equation
                                          Y = y-intercept + slope ´X
   125   126   127   128   129   130   131   132   133   134   135