
Page 319 - Modern Analytical Chemistry
P. 319
1400-CH09 9/9/99 2:12 PM Page 302
302 Modern Analytical Chemistry
9
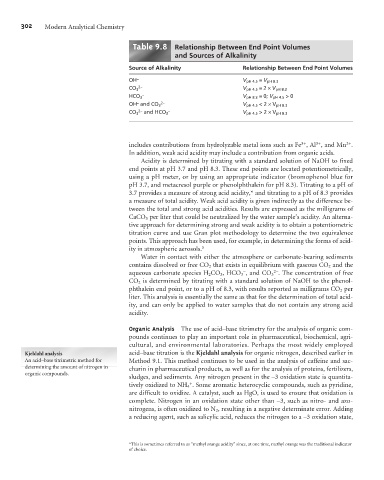
Table .8 Relationship Between End Point Volumes
and Sources of Alkalinity
Source of Alkalinity Relationship Between End Point Volumes
OH – V pH 4.5 = V pH 8.3
2–
CO 3 V pH 4.5 =2 ´V pH 8.3
– V pH 8.3 = 0; V pH 4.5 > 0
HCO 3
– 2–
OH and CO 3 V pH 4.5 < 2 ´V pH 8.3
2– –
CO 3 and HCO 3 V pH 4.5 > 2 ´V pH 8.3
2+
3+
3+
includes contributions from hydrolyzable metal ions such as Fe , Al , and Mn .
In addition, weak acid acidity may include a contribution from organic acids.
Acidity is determined by titrating with a standard solution of NaOH to fixed
end points at pH 3.7 and pH 8.3. These end points are located potentiometrically,
using a pH meter, or by using an appropriate indicator (bromophenol blue for
pH 3.7, and metacresol purple or phenolphthalein for pH 8.3). Titrating to a pH of
3.7 provides a measure of strong acid acidity,* and titrating to a pH of 8.3 provides
a measure of total acidity. Weak acid acidity is given indirectly as the difference be-
tween the total and strong acid acidities. Results are expressed as the milligrams of
CaCO 3 per liter that could be neutralized by the water sample’s acidity. An alterna-
tive approach for determining strong and weak acidity is to obtain a potentiometric
titration curve and use Gran plot methodology to determine the two equivalence
points. This approach has been used, for example, in determining the forms of acid-
ity in atmospheric aerosols. 5
Water in contact with either the atmosphere or carbonate-bearing sediments
contains dissolved or free CO 2 that exists in equilibrium with gaseous CO 2 and the
2–
–
aqueous carbonate species H 2 CO 3 , HCO 3 , and CO 3 . The concentration of free
CO 2 is determined by titrating with a standard solution of NaOH to the phenol-
phthalein end point, or to a pH of 8.3, with results reported as milligrams CO 2 per
liter. This analysis is essentially the same as that for the determination of total acid-
ity, and can only be applied to water samples that do not contain any strong acid
acidity.
Organic Analysis The use of acid–base titrimetry for the analysis of organic com-
pounds continues to play an important role in pharmaceutical, biochemical, agri-
cultural, and environmental laboratories. Perhaps the most widely employed
Kjeldahl analysis acid–base titration is the Kjeldahl analysis for organic nitrogen, described earlier in
An acid–base titrimetric method for Method 9.1. This method continues to be used in the analysis of caffeine and sac-
determining the amount of nitrogen in charin in pharmaceutical products, as well as for the analysis of proteins, fertilizers,
organic compounds.
sludges, and sediments. Any nitrogen present in the –3 oxidation state is quantita-
+
tively oxidized to NH 4 . Some aromatic heterocyclic compounds, such as pyridine,
are difficult to oxidize. A catalyst, such as HgO, is used to ensure that oxidation is
complete. Nitrogen in an oxidation state other than –3, such as nitro- and azo-
nitrogens, is often oxidized to N 2 , resulting in a negative determinate error. Adding
a reducing agent, such as salicylic acid, reduces the nitrogen to a –3 oxidation state,
*This is sometimes referred to as “methyl orange acidity” since, at one time, methyl orange was the traditional indicator
of choice.