
Page 78 - Modern Analytical Chemistry
P. 78
1400-CH04 9/8/99 3:53 PM Page 61
Chapter 4 Evaluating Analytical Data 61
any sample will always be 0.010 g, larger than its true mass (column four of Table
4.5). The analyte’s reported weight percent, which is shown in the last column of
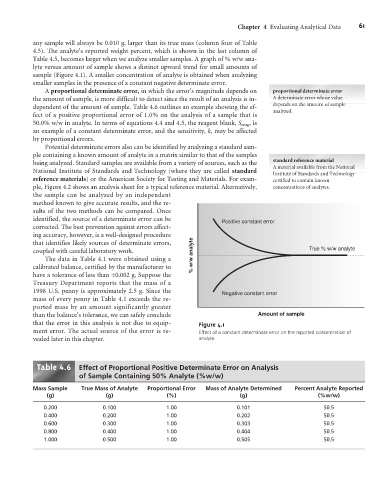
Table 4.5, becomes larger when we analyze smaller samples. A graph of % w/w ana-
lyte versus amount of sample shows a distinct upward trend for small amounts of
sample (Figure 4.1). A smaller concentration of analyte is obtained when analyzing
smaller samples in the presence of a constant negative determinate error.
A proportional determinate error, in which the error’s magnitude depends on proportional determinate error
the amount of sample, is more difficult to detect since the result of an analysis is in- A determinate error whose value
dependent of the amount of sample. Table 4.6 outlines an example showing the ef- depends on the amount of sample
analyzed.
fect of a positive proportional error of 1.0% on the analysis of a sample that is
50.0% w/w in analyte. In terms of equations 4.4 and 4.5, the reagent blank, S reag , is
an example of a constant determinate error, and the sensitivity, k, may be affected
by proportional errors.
Potential determinate errors also can be identified by analyzing a standard sam-
ple containing a known amount of analyte in a matrix similar to that of the samples
being analyzed. Standard samples are available from a variety of sources, such as the standard reference material
A material available from the National
National Institute of Standards and Technology (where they are called standard
Institute of Standards and Technology
reference materials) or the American Society for Testing and Materials. For exam- certified to contain known
ple, Figure 4.2 shows an analysis sheet for a typical reference material. Alternatively, concentrations of analytes.
the sample can be analyzed by an independent
method known to give accurate results, and the re-
sults of the two methods can be compared. Once
identified, the source of a determinate error can be
Positive constant error
corrected. The best prevention against errors affect-
ing accuracy, however, is a well-designed procedure
that identifies likely sources of determinate errors,
coupled with careful laboratory work. % w/w analyte True % w/w analyte
The data in Table 4.1 were obtained using a
calibrated balance, certified by the manufacturer to
have a tolerance of less than ±0.002 g. Suppose the
Treasury Department reports that the mass of a
1998 U.S. penny is approximately 2.5 g. Since the
Negative constant error
mass of every penny in Table 4.1 exceeds the re-
ported mass by an amount significantly greater
than the balance’s tolerance, we can safely conclude Amount of sample
that the error in this analysis is not due to equip- Figure 4.1
ment error. The actual source of the error is re- Effect of a constant determinate error on the reported concentration of
vealed later in this chapter. analyte.
Table 4.6 Effect of Proportional Positive Determinate Error on Analysis
of Sample Containing 50% Analyte (%w/w)
Mass Sample True Mass of Analyte Proportional Error Mass of Analyte Determined Percent Analyte Reported
(g) (g) (%) (g) (%w/w)
0.200 0.100 1.00 0.101 50.5
0.400 0.200 1.00 0.202 50.5
0.600 0.300 1.00 0.303 50.5
0.800 0.400 1.00 0.404 50.5
1.000 0.500 1.00 0.505 50.5