
Page 80 - Modern Analytical Chemistry
P. 80
1400-CH04 9/8/99 3:53 PM Page 63
Chapter 4 Evaluating Analytical Data 63
During the analysis numerous opportunities arise for random variations in the
way individual samples are treated. In determining the mass of a penny, for exam-
ple, each penny should be handled in the same manner. Cleaning some pennies but 30
not cleaning others introduces an indeterminate error.
Finally, any measuring device is subject to an indeterminate error in reading its
scale, with the last digit always being an estimate subject to random fluctuations, or
background noise. For example, a buret with scale divisions every 0.1 mL has an in-
herent indeterminate error of ±0.01 – 0.03 mL when estimating the volume to the
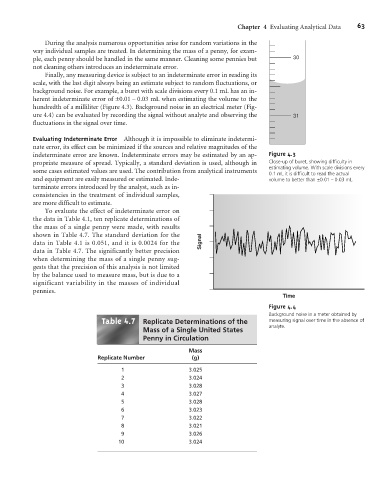
hundredth of a milliliter (Figure 4.3). Background noise in an electrical meter (Fig-
ure 4.4) can be evaluated by recording the signal without analyte and observing the 31
fluctuations in the signal over time.
Evaluating Indeterminate Error Although it is impossible to eliminate indetermi-
nate error, its effect can be minimized if the sources and relative magnitudes of the
indeterminate error are known. Indeterminate errors may be estimated by an ap- Figure 4.3
propriate measure of spread. Typically, a standard deviation is used, although in Close-up of buret, showing difficulty in
estimating volume. With scale divisions every
some cases estimated values are used. The contribution from analytical instruments
0.1 mL it is difficult to read the actual
and equipment are easily measured or estimated. Inde- volume to better than ±0.01 – 0.03 mL.
terminate errors introduced by the analyst, such as in-
consistencies in the treatment of individual samples,
are more difficult to estimate.
To evaluate the effect of indeterminate error on
the data in Table 4.1, ten replicate determinations of
the mass of a single penny were made, with results
shown in Table 4.7. The standard deviation for the
data in Table 4.1 is 0.051, and it is 0.0024 for the Signal
data in Table 4.7. The significantly better precision
when determining the mass of a single penny sug-
gests that the precision of this analysis is not limited
by the balance used to measure mass, but is due to a
significant variability in the masses of individual
pennies.
Time
Figure 4.4
Background noise in a meter obtained by
4 7
Table . Replicate Determinations of the measuring signal over time in the absence of
analyte.
Mass of a Single United States
Penny in Circulation
Mass
Replicate Number (g)
1 3.025
2 3.024
3 3.028
4 3.027
5 3.028
6 3.023
7 3.022
8 3.021
9 3.026
10 3.024