
Page 79 - Modern Analytical Chemistry
P. 79
1400-CH04 9/8/99 3:53 PM Page 62
62 Modern Analytical Chemistry
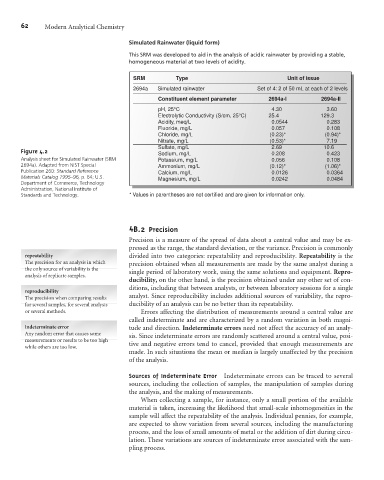
Simulated Rainwater (liquid form)
This SRM was developed to aid in the analysis of acidic rainwater by providing a stable,
homogeneous material at two levels of acidity.
SRM Type Unit of issue
2694a Simulated rainwater Set of 4: 2 of 50 mL at each of 2 levels
Constituent element parameter 2694a-I 2694a-II
pH, 25°C 4.30 3.60
Electrolytic Conductivity (S/cm, 25°C) 25.4 129.3
Acidity, meq/L 0.0544 0.283
Fluoride, mg/L 0.057 0.108
Chloride, mg/L (0.23)* (0.94)*
Nitrate, mg/L (0.53)* 7.19
Sulfate, mg/L 2.69 10.6
Figure 4.2 Sodium, mg/L 0.208 0.423
Analysis sheet for Simulated Rainwater (SRM Potassium, mg/L 0.056 0.108
2694a). Adapted from NIST Special Ammonium, mg/L (0.12)* (1.06)*
Publication 260: Standard Reference Calcium, mg/L 0.0126 0.0364
Materials Catalog 1995–96, p. 64; U.S. Magnesium, mg/L 0.0242 0.0484
Department of Commerce, Technology
Administration, National Institute of
Standards and Technology. * Values in parentheses are not certified and are given for information only.
4 B.2 Precision
Precision is a measure of the spread of data about a central value and may be ex-
pressed as the range, the standard deviation, or the variance. Precision is commonly
repeatability divided into two categories: repeatability and reproducibility. Repeatability is the
The precision for an analysis in which precision obtained when all measurements are made by the same analyst during a
the only source of variability is the single period of laboratory work, using the same solutions and equipment. Repro-
analysis of replicate samples.
ducibility, on the other hand, is the precision obtained under any other set of con-
ditions, including that between analysts, or between laboratory sessions for a single
reproducibility
The precision when comparing results analyst. Since reproducibility includes additional sources of variability, the repro-
for several samples, for several analysts ducibility of an analysis can be no better than its repeatability.
or several methods. Errors affecting the distribution of measurements around a central value are
called indeterminate and are characterized by a random variation in both magni-
indeterminate error tude and direction. Indeterminate errors need not affect the accuracy of an analy-
Any random error that causes some sis. Since indeterminate errors are randomly scattered around a central value, posi-
measurements or results to be too high tive and negative errors tend to cancel, provided that enough measurements are
while others are too low.
made. In such situations the mean or median is largely unaffected by the precision
of the analysis.
Sources of Indeterminate Error Indeterminate errors can be traced to several
sources, including the collection of samples, the manipulation of samples during
the analysis, and the making of measurements.
When collecting a sample, for instance, only a small portion of the available
material is taken, increasing the likelihood that small-scale inhomogeneities in the
sample will affect the repeatability of the analysis. Individual pennies, for example,
are expected to show variation from several sources, including the manufacturing
process, and the loss of small amounts of metal or the addition of dirt during circu-
lation. These variations are sources of indeterminate error associated with the sam-
pling process.