
Page 81 - Modern Analytical Chemistry
P. 81
1400-CH04 9/8/99 3:54 PM Page 64
64 Modern Analytical Chemistry
4 3 Error and Uncertainty
B.
3
error Analytical chemists make a distinction between error and uncertainty. Error is the
A measure of bias in a result or difference between a single measurement or result and its true value. In other
measurement.
words, error is a measure of bias. As discussed earlier, error can be divided into de-
terminate and indeterminate sources. Although we can correct for determinate
error, the indeterminate portion of the error remains. Statistical significance testing,
which is discussed later in this chapter, provides a way to determine whether a bias
resulting from determinate error might be present.
uncertainty Uncertainty expresses the range of possible values that a measurement or result
The range of possible values for a
might reasonably be expected to have. Note that this definition of uncertainty is not
measurement.
the same as that for precision. The precision of an analysis, whether reported as a
range or a standard deviation, is calculated from experimental data and provides an
estimation of indeterminate error affecting measurements. Uncertainty accounts for
all errors, both determinate and indeterminate, that might affect our result. Al-
though we always try to correct determinate errors, the correction itself is subject to
random effects or indeterminate errors.
To illustrate the difference between precision and un-
certainty, consider the use of a class A 10-mL pipet for de-
4
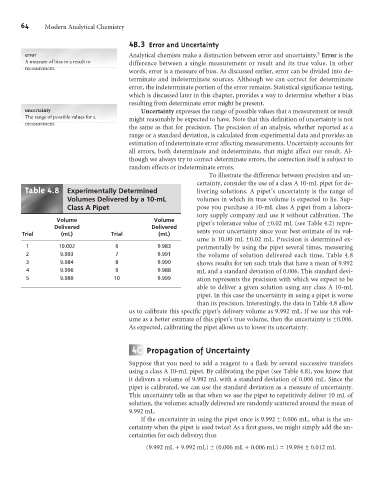
Table .8 Experimentally Determined livering solutions. A pipet’s uncertainty is the range of
Volumes Delivered by a 10-mL volumes in which its true volume is expected to lie. Sup-
Class A Pipet pose you purchase a 10-mL class A pipet from a labora-
tory supply company and use it without calibration. The
Volume Volume pipet’s tolerance value of ±0.02 mL (see Table 4.2) repre-
Delivered Delivered
Trial (mL) Trial (mL) sents your uncertainty since your best estimate of its vol-
ume is 10.00 mL ±0.02 mL. Precision is determined ex-
1 10.002 6 9.983 perimentally by using the pipet several times, measuring
2 9.993 7 9.991 the volume of solution delivered each time. Table 4.8
3 9.984 8 9.990 shows results for ten such trials that have a mean of 9.992
4 9.996 9 9.988 mL and a standard deviation of 0.006. This standard devi-
5 9.989 10 9.999 ation represents the precision with which we expect to be
able to deliver a given solution using any class A 10-mL
pipet. In this case the uncertainty in using a pipet is worse
than its precision. Interestingly, the data in Table 4.8 allow
us to calibrate this specific pipet’s delivery volume as 9.992 mL. If we use this vol-
ume as a better estimate of this pipet’s true volume, then the uncertainty is ±0.006.
As expected, calibrating the pipet allows us to lower its uncertainty.
4 C Propagation of Uncertainty
Suppose that you need to add a reagent to a flask by several successive transfers
using a class A 10-mL pipet. By calibrating the pipet (see Table 4.8), you know that
it delivers a volume of 9.992 mL with a standard deviation of 0.006 mL. Since the
pipet is calibrated, we can use the standard deviation as a measure of uncertainty.
This uncertainty tells us that when we use the pipet to repetitively deliver 10 mL of
solution, the volumes actually delivered are randomly scattered around the mean of
9.992 mL.
If the uncertainty in using the pipet once is 9.992 ± 0.006 mL, what is the un-
certainty when the pipet is used twice? As a first guess, we might simply add the un-
certainties for each delivery; thus
(9.992 mL + 9.992 mL) ± (0.006 mL + 0.006 mL) = 19.984 ± 0.012 mL