
Page 272 - Modern Control Systems
P. 272
246 Chapter 4 Feedback Control System Characteristics
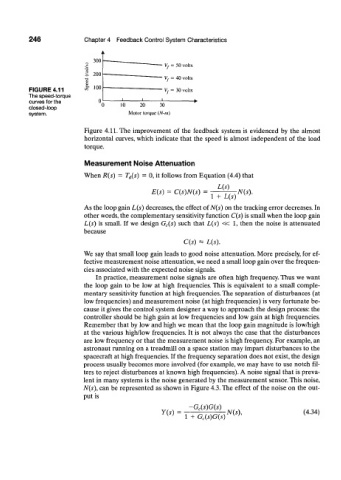
300
•s. Vf = 50 volts
¾
t 200
T3 V f = AO volts
d IOO
FIGURE 4.11 V f = 30 volts
The speed-torque
curves for the 0 0 10 20 30
closed-loop
system. Motor torque (N-m)
Figure 4.11. The improvement of the feedback system is evidenced by the almost
horizontal curves, which indicate that the speed is almost independent of the load
torque.
Measurement Noise Attenuation
When R(s) = T d(s) = 0, it follows from Equation (4.4) that
L(s)
E(s) = C{s)N(s) = N(s).
1 + L(s)
As the loop gain L(s) decreases, the effect of N(s) on the tracking error decreases. In
other words, the complementary sensitivity function C(s) is small when the loop gain
L(s) is small. If we design G c(s) such that L(s) « 1, then the noise is attenuated
because
C(s) * L(s).
We say that small loop gain leads to good noise attenuation. More precisely, for ef-
fective measurement noise attenuation, we need a small loop gain over the frequen-
cies associated with the expected noise signals.
In practice, measurement noise signals are often high frequency. Thus we want
the loop gain to be low at high frequencies. This is equivalent to a small comple-
mentary sensitivity function at high frequencies. The separation of disturbances (at
low frequencies) and measurement noise (at high frequencies) is very fortunate be-
cause it gives the control system designer a way to approach the design process: the
controller should be high gain at low frequencies and low gain at high frequencies.
Remember that by low and high we mean that the loop gain magnitude is low/high
at the various high/low frequencies. It is not always the case that the disturbances
are low frequency or that the measurement noise is high frequency. For example, an
astronaut running on a treadmill on a space station may impart disturbances to the
spacecraft at high frequencies. If the frequency separation does not exist, the design
process usually becomes more involved (for example, we may have to use notch fil-
ters to reject disturbances at known high frequencies). A noise signal that is preva-
lent in many systems is the noise generated by the measurement sensor. This noise,
N(s), can be represented as shown in Figure 4.3. The effect of the noise on the out-
put is
-G c(s)G(s)
Y ( 4 3 4 )
^ = 1 , ^ ) ^ -