
Page 65 - Modern Control Systems
P. 65
Problems 39
system using Figure 1.3 as the model. Identify the El.14 Describe the block diagram of a person playing a
process, sensor, actuator, and controller. The objective video game. Suppose that the input device is a joystick
is keep the pendulum in the upright position, that is to and the game is being played on a desktop computer.
keep 6 = 0, in the presence of disturbances. Use Figure 1.3 as a model of the block diagram.
PROBLEMS
Problems require extending the concepts of this chapter to stream may be controlled. Complete the control feed-
new situations. back loop, and sketch a block diagram describing the
The following systems may be described by a block operation of the control loop.
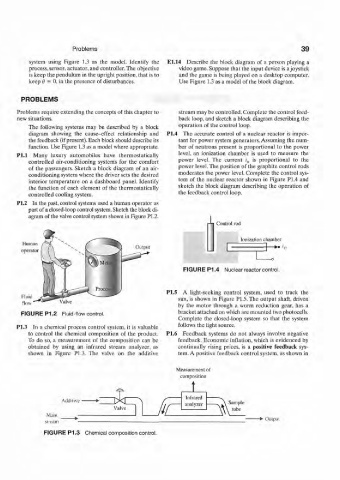
diagram showing the cause-effect relationship and P1.4 The accurate control of a nuclear reactor is impor-
the feedback (if present). Each block should describe its tant for power system generators. Assuming the num-
function. Use Figure 1.3 as a model where appropriate. ber of neutrons present is proportional to the power
Pl.l Many luxury automobiles have thermostatically level, an ionization chamber is used to measure the
controlled air-conditioning systems for the comfort power level. The current i„ is proportional to the
of the passengers. Sketch a block diagram of an air- power level. The position of the graphite control rods
conditioning system where the driver sets the desired moderates the power level. Complete the control sys-
interior temperature on a dashboard panel. Identify tem of the nuclear reactor shown in Figure PI.4 and
the function of each element of the thermostatically sketch the block diagram describing the operation of
controlled cooling system. the feedback control loop.
P1.2 In the past, control systems used a human operator as
part of a closed-loop control system. Sketch the block di-
agram of the valve control system shown in Figure PI.2.
t\
Control rod
Ionization chamber
Human
operator Output
FIGURE P1.4 Nuclear reactor control.
P1.5 A light-seeking control system, used to track the
sun, is shown in Figure PL5. The output shaft, driven
Valve
by the motor through a worm reduction gear, has a
FIGURE P1.2 Fluid-flow control. bracket attached on which are mounted two photocells.
Complete the closed-loop system so that the system
follows the light source.
P1.3 In a chemical process control system, it is valuable
to control the chemical composition of the product. P1.6 Feedback systems do not always involve negative
To do so, a measurement of the composition can be feedback. Economic inflation, which is evidenced by
obtained by using an infrared stream analyzer, as continually rising prices, is a positive feedback sys-
shown in Figure PI.3. The valve on the additive tem. A positive feedback control system, as shown in
Measurement of
composition
Additive
• Output
FIGURE P1.3 Chemical composition control.