
Page 136 - MODERN ELECTROCHEMISTRY
P. 136
76 CHAPTER 2
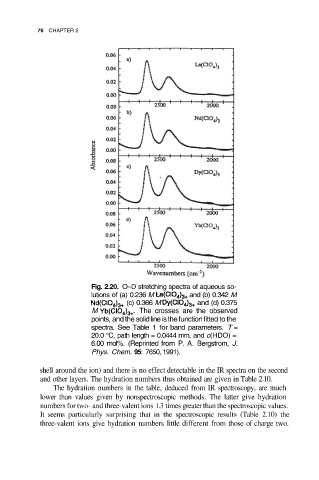
Fig. 2.20. O–D stretching spectra of aqueous so-
lutions of (a) 0.236 M and (b) 0.342 M
(c) 0.366 M and (d) 0.375
M The crosses are the observed
points, and the solid line is the function fitted to the
spectra. See Table 1 for band parameters. T =
20.0 °C, path length = 0.0444 mm, and c(HDO) =
6.00 mol%. (Reprinted from P. A. Bergstrom, J.
Phys. Chem. 95: 7650, 1991).
shell around the ion) and there is no effect detectable in the IR spectra on the second
and other layers. The hydration numbers thus obtained are given in Table 2.10.
The hydration numbers in the table, deduced from IR spectroscopy, are much
lower than values given by nonspectroscopic methods. The latter give hydration
numbers for two- and three-valent ions 1.3 times greater than the spectroscopic values.
It seems particularly surprising that in the spectroscopic results (Table 2.10) the
three-valent ions give hydration numbers little different from those of charge two.