
Page 111 - Modern Optical Engineering The Design of Optical Systems
P. 111
94 Chapter Five
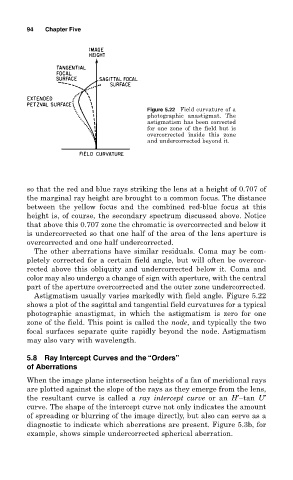
Figure 5.22 Field curvature of a
photographic anastigmat. The
astigmatism has been corrected
for one zone of the field but is
overcorrected inside this zone
and undercorrected beyond it.
so that the red and blue rays striking the lens at a height of 0.707 of
the marginal ray height are brought to a common focus. The distance
between the yellow focus and the combined red-blue focus at this
height is, of course, the secondary spectrum discussed above. Notice
that above this 0.707 zone the chromatic is overcorrected and below it
is undercorrected so that one half of the area of the lens aperture is
overcorrected and one half undercorrected.
The other aberrations have similar residuals. Coma may be com-
pletely corrected for a certain field angle, but will often be overcor-
rected above this obliquity and undercorrected below it. Coma and
color may also undergo a change of sign with aperture, with the central
part of the aperture overcorrected and the outer zone undercorrected.
Astigmatism usually varies markedly with field angle. Figure 5.22
shows a plot of the sagittal and tangential field curvatures for a typical
photographic anastigmat, in which the astigmatism is zero for one
zone of the field. This point is called the node, and typically the two
focal surfaces separate quite rapidly beyond the node. Astigmatism
may also vary with wavelength.
5.8 Ray Intercept Curves and the “Orders”
of Aberrations
When the image plane intersection heights of a fan of meridional rays
are plotted against the slope of the rays as they emerge from the lens,
the resultant curve is called a ray intercept curve or an H′–tan U′
curve. The shape of the intercept curve not only indicates the amount
of spreading or blurring of the image directly, but also can serve as a
diagnostic to indicate which aberrations are present. Figure 5.3b, for
example, shows simple undercorrected spherical aberration.