
Page 224 - Modern Spatiotemporal Geostatistics
P. 224
Single-Point Analytical Formulations 205
3
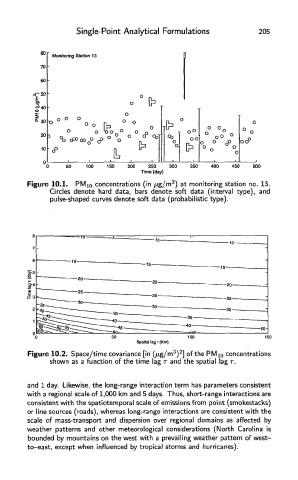
Figure 10.1. PMi 0 concentrations (in /zg/m ) at monitoring station no. 13.
Circles denote hard data, bars denote soft data (interval type), and
pulse-shaped curves denote soft data (probabilistic type).
3 2
Figure 10.2. Space/time covariance [in (/ig/m ) ] of the PMio concentrations
shown as a function of the time lag r and the spatial lag r.
and 1 day. Likewise, the long-range interaction term has parameters consistent
with a regional scale of 1,000 km and 5 days. Thus, short-range interactions are
consistent with the spatiotemporal scale of emissions from point (smokestacks)
or line sources (roads), whereas long-range interactions are consistent with the
scale of mass-transport and dispersion over regional domains as affected by
weather patterns and other meteorological considerations (North Carolina is
bounded by mountains on the west with a prevailing weather pattern of west-
to-east, except when influenced by tropical storms and hurricanes).