
Page 225 - Modern Spatiotemporal Geostatistics
P. 225
206 Modern Spatiotemporal Geostatistics — Chapter 10
3
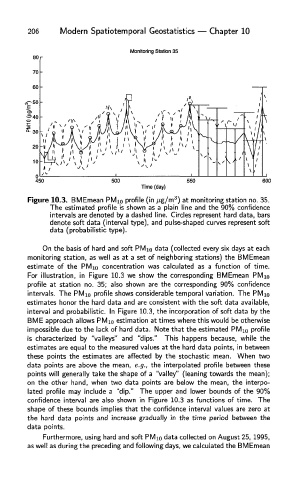
Figure 10.3. BMEmean PMio profile (in /Ltg/m ) at monitoring station no. 35.
The estimated profile is shown as a plain line and the 90% confidence
intervals are denoted by a dashed line. Circles represent hard data, bars
denote soft data (interval type), and pulse-shaped curves represent soft
data (probabilistic type).
On the basis of hard and soft PMio data (collected every six days at each
monitoring station, as well as at a set of neighboring stations) the BMEmean
estimate of the PMio concentration was calculated as a function of time.
For illustration, in Figure 10.3 we show the corresponding BMEmean PMio
profile at station no. 35; also shown are the corresponding 90% confidence
intervals. The PMio profile shows considerable temporal variation. The PMio
estimates honor the hard data and are consistent with the soft data available,
interval and probabilistic. In Figure 10.3, the incorporation of soft data by the
BME approach allows PMi 0 estimation at times where this would be otherwise
impossible due to the lack of hard data. Note that the estimated PMio profile
is characterized by "valleys" and "dips." This happens because, while the
estimates are equal to the measured values at the hard data points, in between
these points the estimates are affected by the stochastic mean. When two
data points are above the mean, e.g., the interpolated profile between these
points will generally take the shape of a "valley" (leaning towards the mean);
on the other hand, when two data points are below the mean, the interpo-
lated profile may include a "dip." The upper and lower bounds of the 90%
confidence interval are also shown in Figure 10.3 as functions of time. The
shape of these bounds implies that the confidence interval values are zero at
the hard data points and increase gradually in the time period between the
data points.
Furthermore, using hard and soft PMio data collected on August 25, 1995,
as well as during the preceding and following days, we calculated the BMEmean