
Page 228 - Modern Spatiotemporal Geostatistics
P. 228
Single-Point Analytical Formulations 209
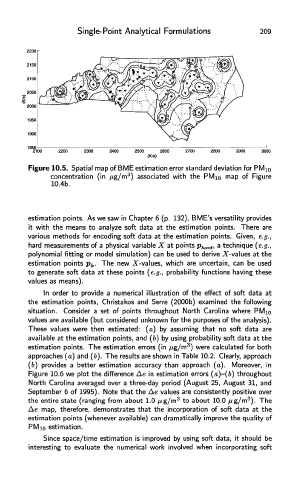
Figure 10.5. Spatial map of BME estimation error standard deviation for PMi 0
3
concentration (in ^g/m ) associated with the PMi 0 map of Figure
10.4b.
estimation points. As we saw in Chapter 6 (p. 132), BME's versatility provides
it with the means to analyze soft data at the estimation points. There are
various methods for encoding soft data at the estimation points. Given, e.g
hard measurements of a physical variable X at points p^^, a technique (e.g.,
polynomial fitting or model simulation) can be used to derive ^"-values at the
estimation points p k. The new X-values, which are uncertain, can be used
to generate soft data at these points (e.g., probability functions having these
values as means).
In order to provide a numerical illustration of the effect of soft data at
the estimation points, Christakos and Serre (2000b) examined the following
situation. Consider a set of points throughout North Carolina where PMio
values are available (but considered unknown for the purposes of the analysis).
These values were then estimated: (a) by assuming that no soft data are
available at the estimation points, and (b) by using probability soft data at the
3
estimation points. The estimation errors (in /^g/m ) were calculated for both
approaches (a) and (b). The results are shown in Table 10.2. Clearly, approach
(b) provides a better estimation accuracy than approach (a). Moreover, in
Figure 10.6 we plot the difference Ae in estimation errors (a)-(b) throughout
North Carolina averaged over a three-day period (August 25, August 31, and
September 6 of 1995). Note that the Ae values are consistently positive over
3
the entire state (ranging from about 1.0 ^g/m 3 to about 10.0 /zg/m ). The
Ae map, therefore, demonstrates that the incorporation of soft data at th
estimation points (whenever available) can dramatically improve the quality of
PMio estimation.
Since space/time estimation is improved by using soft data, it should be
interesting to evaluate the numerical work involved when incorporating soft