
Page 227 - Modern Spatiotemporal Geostatistics
P. 227
T08 Modernn Spatiotermmporal l Geostatttistiticss ----- Chapterr 10
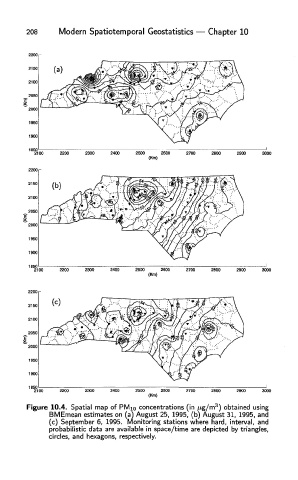
Figure 10.4. Spatial map of PMio concentrations (in /xg/m3) obtained using
BMEmean estimates on (a) August 25, 1995, (b) August 31, 1995, and
(c) September 6, 1995. Monitoring stations where hard, interval, and
probabilistic data are available in space/time are depicted by triangles,
circles, and hexagons, respectively.