
Page 148 - Modern physical chemistry
P. 148
References 139
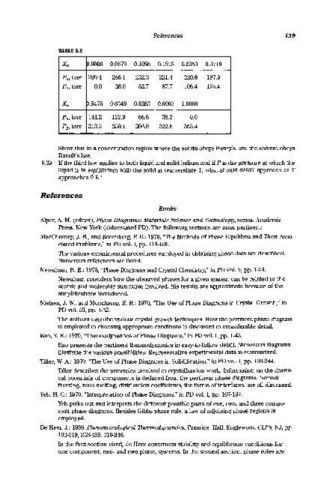
TABLE 6.E
X B ~>.OOOO 0.0579 0.1095 0.1918 0.2353 0.3718
P A , torr 280.4 266.1 252.3 231.4 220.8 187.9
PB' torr 0.0 28.0 52.7 87.7 105.4 155.4
X B p.5478 0.6349 0.8253 0.9093 1.0000
PM torr 144.2 122.9 66.6 38.2 0.0
PB' torr 213.3 239.1 296.9 322.5 353.4
Show that in a concentration region where the solute obeys Henry's law, the solvent obeys
Raoult's law.
6.29 If the third law applies to both liquid and solid helium and if P is the pressure at which the
liquid is in equilibrium with the solid at temperature T, what should dP/dT approach as T
approaches 0 K?
References
Books
Alper, A. M. (editor), Phase Diagrams: Materials Science and Technology, series, Academic
Press, New York (abbreviated PD). The following sections are most pertinent:
MacChesney, J. B., and Rosenberg, P. E.: 1970, "The Methods of Phase Equilibria and Their Asso-
ciated Problems," in PD vol. I, pp. 113-165.
The various experimental procedures employed in obtaining phase data are described.
Numerous references are listed.
Newnham, R E.: 1978, "Phase Diagrams and Crystal Chemistry," in PD vol. V, pp. 1-73.
Newnham considers how the observed phases for a given system can be related to the
atomic and molecular structures involved. His results are approximate because of the
simplifications introduced.
Nielsen, J. W., and Monchamp, R R: 1970, "The Use of Phase Diagrams in Crystal Growth," in
PD vol. III, pp. 1-52.
The authors describe various crystal growth techniques. How the pertinent phase diagram
is employed in choosing appropriate conditions is discussed in considerable detail.
Rao, Y. K.: 1970, "Thermodynamics of Phase Diagrams," in PD vol. I, pp. 1-43.
Rao presents the pertinent thermodynamics in easy-to-follow detail. Numerous diagrams
illustrate the various possibilities. Representative experimental data is summarized.
Tiller, W. A.: 1970, "The Use of Phase Diagrams in Solidification," in PD vol. I, pp. 199-244.
Tiller describes the principles involved in crystallization work. Information on the chemi-
cal potentials of components is deduced from the pertinent phase diagrams. Normal
freezing, zone melting, distribution coefficients, the forms of interfaces, are all discussed.
Yeh, H. C.: 1970, "Interpretation of Phase Diagrams," in PD vol. I, pp. 167-197.
Yeh picks out and interprets the different possible parts of one, two, and three compo-
nent phase diagrams. Besides Gibbs phase rule, a law of adjoining phase regions is
employed.
De Heer, J.: 1986, Phenomenological Thermodynamics, Prentice- Hall, Englewood Cliffs, NJ, pp.
192-219, 253-285, 310-346.
In the first section cited, de Heer constructs stability and equilibrium conditions for
one-component, one- and two-phase, systems. In the second section, phase rules are