
Page 35 - Multifunctional Photocatalytic Materials for Energy
P. 35
24 Multifunctional Photocatalytic Materials for Energy
(C)
(A)
14 (B)
12 Ideal hematite
photoanode
10
J/mA cm –2 8 6 Surface chemistry Morphology
control
2 4 and catalysis
0
0.4 0.6 0.8 1.0 1.2 1.4 1.6
V /V vs. RHE
(D) 1.4 (E)
1.2
200×10 3 800 C 1.0
700 C 0.8 800 C 700 C
150
α (cm –1 ) 100 400 C J (mA× cm –2 ) 0.6
50 400 C 700 C 800 C 0.4 400 C
0.2
0
0.0 800 C dark
350 400 450 500 550 600 650 700 750 800 850
Photon wavelength (nm)
0.8 1.0 1.2 1.4 1.6V
E (V vs. RHE)
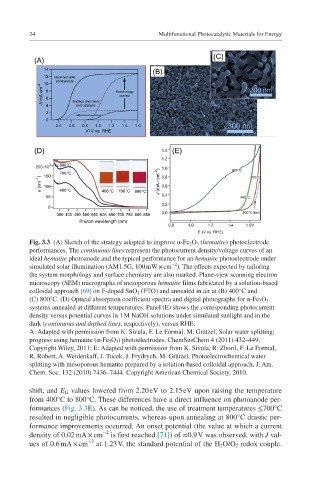
Fig. 3.3 (A) Sketch of the strategy adopted to improve α-Fe 2 O 3 (hematite) photoelectrode
performances. The continuous lines represent the photocurrent density/voltage curves of an
ideal hematite photoanode and the typical performance for an hematite photoelectrode under
−2
simulated solar illumination (AM1.5G, 100 mW × cm ). The effects expected by tailoring
the system morphology and surface chemistry are also marked. Plane-view scanning electron
microscopy (SEM) micrographs of mesoporous hematite films fabricated by a solution-based
colloidal approach [69] on F-doped SnO 2 (FTO) and annealed in air at (B) 400°C and
(C) 800°C. (D) Optical absorption coefficient spectra and digital photographs for α-Fe 2 O 3
systems annealed at different temperatures. Panel (E) shows the corresponding photocurrent
density versus potential curves in 1 M NaOH solutions under simulated sunlight and in the
dark (continuous and dashed lines, respectively), versus RHE.
A: Adapted with permission from K. Sivula, F. Le Formal, M. Grätzel, Solar water splitting:
progress using hematite (α-Fe 2 O 3 ) photoelectrodes, ChemSusChem 4 (2011) 432–449.
Copyright Wiley, 2011; E: Adapted with permission from K. Sivula, R. Zboril, F. Le Formal,
R. Robert, A. Weidenkaff, J. Tucek, J. Frydrych, M. Grätzel, Photoelectrochemical water
splitting with mesoporous hematite prepared by a solution-based colloidal approach, J. Am.
Chem. Soc. 132 (2010) 7436–7444. Copyright American Chemical Society, 2010.
shift, and E G values lowered from 2.20 eV to 2.15 eV upon raising the temperature
from 400°C to 800°C. These differences have a direct influence on photoanode per-
formances (Fig. 3.3E). As can be noticed, the use of treatment temperatures ≤700°C
resulted in negligible photocurrents, whereas upon annealing at 800°C drastic per-
formance improvements occurred. An onset potential (the value at which a current
−2
density of 0.02 mA × cm is first reached [71]) of ≈0.9 V was observed, with J val-
−2
ues of 0.6 mA × cm at 1.23 V, the standard potential of the H 2 O/O 2 redox couple.