
Page 193 - Book Hosokawa Nanoparticle Technology Handbook
P. 193
3.8 SIMULATION OF COLLOIDAL DISPERSION SYSTEM FUNDAMENTALS
To explain the relationship between molecular
Key MW
1.0 weight and suspension viscosity with different particle
300
1200 size and solid fraction, the analysis of estimated sur-
0.5 10000 face distance in Section 3.1 is useful. The surface dis-
tance decreased with increase in solid fraction and was
without disp same as the size of polymer dispersant less than 1 nm.
Force (nN) 0.0 Large molecular weight polymer dispersant cannot
invade between particle surfaces of formed bridge
between the particles. Such bridging phenomena of
-0.5
large molecular weight dispersant between particles
promoted particle aggregation and increase in suspen-
-1.0
MW = 10000 sion viscosity.
-1.5
0 20 40 60 80 100
References
Distance (nm)
[1] T. Kakui, T. Miyauchi and H. Kamiya: J. Euro. Ceram.
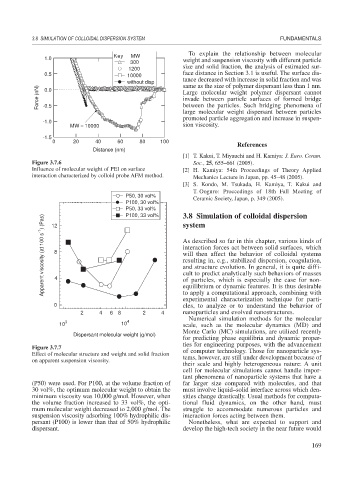
Figure 3.7.6 Soc., 25, 655–661 (2005).
Influence of molecular weight of PEI on surface [2] H. Kamiya: 54th Proceedings of Theory Applied
interaction characterized by colloid probe AFM method. Mechanics Lecture in Japan, pp. 45–48 (2005).
[3] S. Kondo, M. Tsukada, H. Kamiya, T. Kakui and
T. Ooguro: Proceedings of 18th Fall Meeting of
P50, 30 vol%
Ceramic Society, Japan, p. 349 (2005).
P100, 30 vol%
P50, 33 vol% 3.8 Simulation of colloidal dispersion
P100, 33 vol%
Apparent viscosity (at 100 s -1 ) (Pas) 8 As described so far in this chapter, various kinds of
system
12
interaction forces act between solid surfaces, which
will then affect the behavior of colloidal systems
resulting in, e.g., stabilized dispersion, coagulation,
and structure evolution. In general, it is quite diffi-
cult to predict analytically such behaviors of masses
4
of particles, which is especially the case for non-
equilibrium or dynamic features. It is thus desirable
to apply a computational approach, combining with
experimental characterization technique for parti-
0 cles, to analyze or to understand the behavior of
2 4 6 8 2 4 nanoparticles and evolved nanostructures.
Numerical simulation methods for the molecular
10 3 10 4 scale, such as the molecular dynamics (MD) and
Monte Carlo (MC) simulations, are utilized recently
Dispersant molecular weight (g/mol)
for predicting phase equilibria and dynamic proper-
ties for engineering purposes, with the advancement
Figure 3.7.7
Effect of molecular structure and weight and solid fraction of computer technology. Those for nanoparticle sys-
on apparent suspension viscosity. tems, however, are still under development because of
their scale and highly heterogeneous nature: A unit
cell for molecular simulations cannot handle impor-
tant phenomena of nanoparticle systems that have a
(P50) were used. For P100, at the volume fraction of far larger size compared with molecules, and that
30 vol%, the optimum molecular weight to obtain the must involve liquid–solid interface across which den-
minimum viscosity was 10,000 g/mol. However, when sities change drastically. Usual methods for computa-
the volume fraction increased to 33 vol%, the opti- tional fluid dynamics, on the other hand, must
mum molecular weight decreased to 2,000 g/mol. The struggle to accommodate numerous particles and
suspension viscosity adsorbing 100% hydrophilic dis- interaction forces acting between them.
persant (P100) is lower than that of 50% hydrophilic Nonetheless, what are expected to support and
dispersant. develop the high-tech society in the near future would
169