
Page 340 - Book Hosokawa Nanoparticle Technology Handbook
P. 340
5.6 EVALUATION METHODS FOR OXIDE HETEROSTRUCTURES FUNDAMENTALS
lattice tend to be extended into the SrTiO lattice.
3
From the semi-log plot of the Ti 3 fraction, the
screening length of the charge transfer is estimated to
be about 1 nm [12].
Considering such charge transfer, it is attempted to
form the electronic channel of high mobility on the
polarity discontinuity heterointerface between the
band insulators of perovskite oxide [13]. Furthermore,
by use of this nanoprobing technique, the quantitative
determination of oxygen vacancy in the artificially
prepared in SrTiO thin film or in the natural grain
3
boundary and the structural evaluation on the atomic
level are conducted [14, 15]. The nanoprobing tech-
nique using STEM can directly observe the electronic
state at the buried interface with the atomic resolution
and will be more and more important for the research
of this field in the future.
References
[1] A. Tsukazaki, A. Ohtomo and M. Kawasaki: Oyo
Buturi, 74, 1359–1364 (2005) (in Japanese).
[2] P.F. Fewster: Rep. Prog. Phys., 59, 1339–1407 (1996).
[3] D.A. Mueller, T. Sorsch, S. Moccio, F.H. Baumann,
K. Evans-Lutterodt and G. Timp: Nature, 339,
758–761 (1999).
[4] M. Kawasaki, A. Ohtomo: Solid State Phys., 33,
59–64 (1998) (in Japanese).
[5] J. Narayan, P. Tiwari, X. Chen, J. Singh, R. Chowdhury
Figure 5.6.6 and T. Zheleva: Appl. Phys. Lett., 61, 1290–1292 (1992).
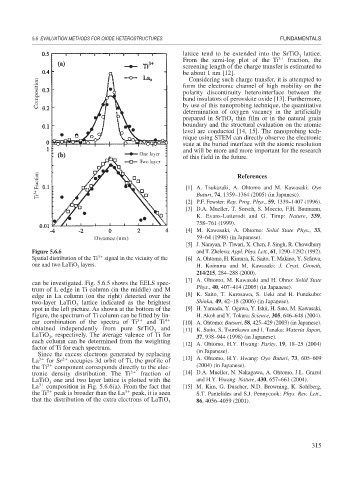
Spatial distribution of the Ti 3 signal in the vicinity of the [6] A. Ohtomo, H. Kimura, K. Saito, T. Makino, Y. Sefawa,
one and two LaTiO layers. H. Koinuma and M. Kawasaki: J. Cryst. Growth,
3
214/215, 284–288 (2000).
[7] A. Ohtomo, M. Kawasaki and H. Ohno: Solid State
can be investigated. Fig. 5.6.5 shows the EELS spec-
trum of L edge in Ti column (in the middle) and M Phys., 40, 407–414 (2005) (in Japanese).
edge in La column (on the right) detected over the [8] K. Saito, T. Kurosawa, S. Ueki and H. Funakubo:
two-layer LaTiO lattice indicated as the brightest Shinku, 49, 42–18 (2006) (in Japanese).
3
spot in the left picture. As shown at the bottom of the [9] H. Yamada, Y. Ogawa, Y. Ishii, H. Sato, M. Kawasaki,
figure, the spectrum of Ti column can be fitted by lin- H. Akoh and Y. Tokura: Science, 305, 646–648 (2004).
ear combination of the spectra of Ti 3 and Ti 4 [10] A. Ohtomo: Butsuri, 58, 425–429 (2003) (in Japanese).
obtained independently from pure SrTiO 3 and [11] K. Saito, S. Tsurekawa and I. Tanaka: Materia Japan,
LaTiO , respectively. The average valence of Ti for 37, 938–944 (1998) (in Japanese).
3
each column can be determined from the weighting [12] A. Ohtomo, H.Y. Hwang: Parity, 19, 18–25 (2004)
factor of Ti for each spectrum. (in Japanese).
Since the excess electrons generated by replacing
La 3 for Sr 2 occupies 3d orbit of Ti, the profile of [13] A. Ohtomo, H.Y. Hwang: Oyo Buturi, 73, 605–609
the Ti 3 component corresponds directly to the elec- (2004) (in Japanese).
tronic density distribution. The Ti 3 fraction of [14] D.A. Mueller, N. Nakagawa, A. Ohtomo, J.L. Grazul
LaTiO one and two layer lattice is plotted with the and H.Y. Hwang: Nature, 430, 657–661 (2004).
3
La 3 composition in Fig. 5.6.6(a). From the fact that [15] M. Kim, G. Duscher, N.D. Browning, K. Sohlberg,
the Ti 3 peak is broader than the La 3 peak, it is seen S.T. Pantelides and S.J. Pennycook: Phys. Rev. Lett.,
that the distribution of the extra electrons of LaTiO 3 86, 4056–4059 (2001).
315