
Page 336 - Book Hosokawa Nanoparticle Technology Handbook
P. 336
5.5 GRAIN BOUNDARIES AND INTERFACES FUNDAMENTALS
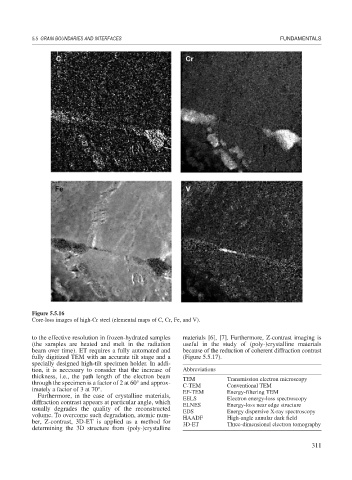
Figure 5.5.16
Core-loss images of high-Cr steel (elemental maps of C, Cr, Fe, and V).
to the effective resolution in frozen-hydrated samples materials [6], [7]. Furthermore, Z-contrast imaging is
(the samples are heated and melt in the radiation useful in the study of (poly-)crystalline materials
beam over time). ET requires a fully automated and because of the reduction of coherent diffraction contrast
fully digitized TEM with an accurate tilt stage and a (Figure 5.5.17).
specially designed high-tilt specimen holder. In addi-
tion, it is necessary to consider that the increase of Abbreviations
thickness, i.e., the path length of the electron beam TEM Transmission electron microscopy
through the specimen is a factor of 2 at 60° and approx- C-TEM Conventional TEM
imately a factor of 3 at 70°. EF-TEM Energy-filtering TEM
Furthermore, in the case of crystalline materials, EELS Electron energy-loss spectroscopy
diffraction contrast appears at particular angle, which ELNES Energy-loss near edge structure
usually degrades the quality of the reconstructed EDS Energy dispersive X-ray spectroscopy
volume. To overcome such degradation, atomic num- HAADF High-angle annular dark field
ber, Z-contrast, 3D-ET is applied as a method for 3D-ET Three-dimensional electron tomography
determining the 3D structure from (poly-)crystalline
311