
Page 332 - Book Hosokawa Nanoparticle Technology Handbook
P. 332
5.5 GRAIN BOUNDARIES AND INTERFACES FUNDAMENTALS
4
Surface
Characteristic
Conduction band X-ray 3
Transmissivity 2
Valence band
Process 3
L shell E L3
3
L shell E L2
2
1
shell E
L 1 L1
Incident Process 2
electron
0
0 200 400 600 800 1000
K shell E K Acceleration Voltage (kV)
Process1
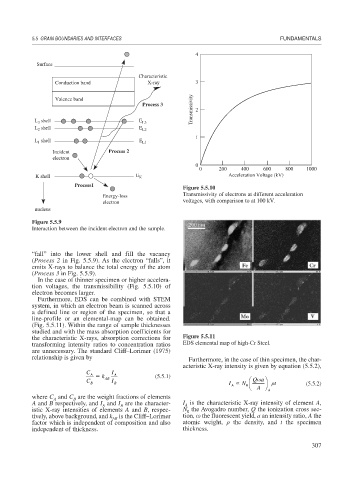
Figure 5.5.10
Energy-loss Transmissivity of electrons at different acceleration
electron voltages, with comparison to at 100 kV.
nucleus
Figure 5.5.9
Interaction between the incident electron and the sample.
“fall” into the lower shell and fill the vacancy
(Process 2 in Fig. 5.5.9). As the electron “falls”, it
emits X-rays to balance the total energy of the atom
(Process 3 in Fig. 5.5.9).
In the case of thinner specimen or higher accelera-
tion voltages, the transmissibility (Fig. 5.5.10) of
electron becomes larger.
Furthermore, EDS can be combined with STEM
system, in which an electron beam is scanned across
a defined line or region of the specimen, so that a
line-profile or an elemental-map can be obtained.
(Fig. 5.5.11). Within the range of sample thicknesses
studied and with the mass absorption coefficients for
the characteristic X-rays, absorption corrections for Figure 5.5.11
transforming intensity ratios to concentration ratios EDS elemental map of high-Cr Steel.
are unnecessary. The standard Cliff–Lorimer (1975)
relationship is given by Furthermore, in the case of thin specimen, the char-
acteristic X-ray intensity is given by equation (5.5.2),
C A I A
k AB (5.5.1) ⎛ Qa⎞
C B I B I N 0 ⎜ ⎝ ⎟ t (5.5.2)
A ⎠
A
where C and C are the weight fractions of elements A
A
B
A and B respectively, and I and I are the character- I is the characteristic X-ray intensity of element A,
A
A
B
istic X-ray intensities of elements A and B, respec- N the Avogadro number, Q the ionization cross sec-
0
tively, above background, and k AB is the Cliff–Lorimer tion, the fluorescent yield, a an intensity ratio, A the
factor which is independent of composition and also atomic weight, the density, and t the specimen
independent of thickness. thickness.
307