
Page 45 - Book Hosokawa Nanoparticle Technology Handbook
P. 45
FUNDAMENTALS CH. 1 BASIC PROPERTIES AND MEASURING METHODS OF NANOPARTICLES
necessary to take account of voids or pores exiting in a flat surface, condensation may occur within smaller
the particle for estimating particle size from the meas- pores as the local pressure may attain the saturation
urement of specific surface area. level. In contrast, supposing that the gas pressure
Taking into account size of nanoparticles, pore decreases in sequence from relative pressure 1, evap-
size relating strongly to these particles would be less oration occurs at first from flat surfaces, then from
than approximately 5nm (micropore) and 5–50nm larger pores, and eventually from smaller pores.
(mesopore) in radius. If all the gas adsorption takes place solely due to
From the scientific viewpoint of adsorption, capillary condensation, the pore size distribution can
micropore can be categorized and measured as follows. be obtained from equation 1.6.7, which is a relatively
The surface on which multilayer of molecular adsorp- easy and simple procedure. However, it is highly
tion develops is termed as “external surface”, and the unlikely in practice that absorbed gas under a certain
surface on which multilayer adsorption cannot occur pressure is all in state of capillary condensation.
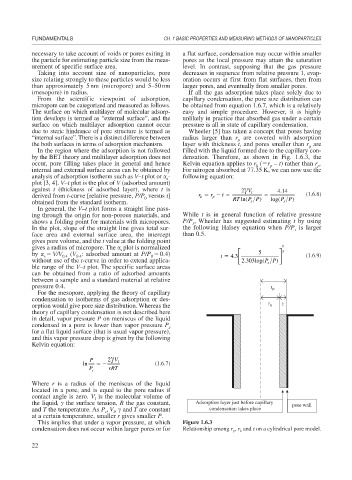
due to steric hindrance of pore structure is termed as Wheeler [5] has taken a concept that pores having
“internal surface”. There is a distinct difference between radius larger than r are covered with adsorption
p
the both surfaces in terms of adsorption mechanism. layer with thickness t, and pores smaller than r are
p
In the region where the adsorption is not followed filled with the liquid formed due to the capillary con-
by the BET theory and multilayer adsorption does not densation. Therefore, as shown in Fig. 1.6.3, the
occur, pore filling takes place in general and hence Kelvin equation applies to r ( r – t) rather than r .
k
p
p
internal and external surface areas can be obtained by For nitrogen absorbed at 77.35 K, we can now use the
analysis of adsorption isotherm such as V–t plot or
- following equation:
s
plot [3, 4]. V–t plot is the plot of V (adsorbed amount)
against t (thickness of adsorbed layer), where t is 2 V l 414
.
t
derived from t-curve [relative pressure, P/P versus t] r r RT ln(PP ) log(PP ) (1.6.8)
k
p
0
obtained from the standard isotherm. s s
In general, the V–t plot forms a straight line pass-
ing through the origin for non-porous materials, and While t is in general function of relative pressure
shows a folding point for materials with micropores. P/P , Wheeler has suggested estimating t by using
s
In the plot, slope of the straight line gives total sur- the following Halsey equation when P/P is larger
s
face area and external surface area, the intercept than 0.5.
gives pore volume, and the t value at the folding point
gives a radius of micropore. The
plot is normalized ⎡ 1 3 ⎤
s
by
V/V 0.4 (V : adsorbed amount at P/P 0.4) t 43 ⎢ 5 ⎥ (1.6.9)
.
0
s
0.4
without use of the t-curve in order to extend applica- ⎣ 2 303log(PP ) ⎦
.
s
ble range of the V–t plot. The specific surface areas
can be obtained from a ratio of adsorbed amounts
between a sample and a standard material at relative
pressure 0.4. r p
For the mesopore, applying the theory of capillary
condensation to isotherms of gas adsorption or des-
orption would give pore size distribution. Whereas the r k t
theory of capillary condensation is not described here
in detail, vapor pressure P on meniscus of the liquid
condensed in a pore is lower than vapor pressure P s
for a flat liquid surface (that is usual vapor pressure),
and this vapor pressure drop is given by the following
Kelvin equation:
P 2 V l
ln (1.6.7)
P rRT
s
Where r is a radius of the meniscus of the liquid
located in a pore, and is equal to the pore radius if
contact angle is zero. V is the molecular volume of
l
the liquid, the surface tension, R the gas constant, Adsorption layer just before capillary pore wall
and T the temperature. As P , V , and T are constant condensation takes place
l
s
at a certain temperature, smaller r gives smaller P.
This implies that under a vapor pressure, at which Figure 1.6.3
condensation does not occur within larger pores or for Relationship among r , r and t on a cylindrical pore model.
p
k
22