
Page 627 - Book Hosokawa Nanoparticle Technology Handbook
P. 627
42 FABRICATION TECHNIQUE OF ORGANIC NANOCRYSTALS APPLICATIONS
3. Size-dependence of optical properties for organic
nanocrystals
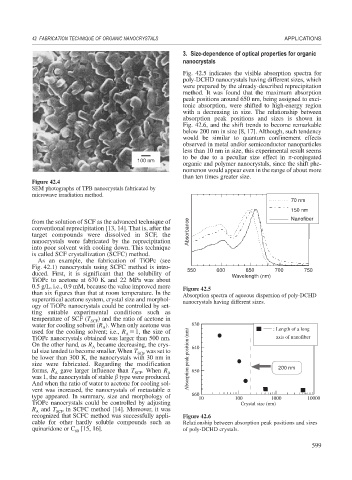
Fig. 42.5 indicates the visible absorption spectra for
poly-DCHD nanocrystals having different sizes, which
were prepared by the already-described reprecipitation
method. It was found that the maximum absorption
peak positions around 650 nm, being assigned to exci-
tonic absorption, were shifted to high-energy region
with a decreasing in size. The relationship between
absorption peak positions and sizes is shown in
Fig. 42.6, and the shift trends to become remarkable
below 200 nm in size [8, 17]. Although, such tendency
would be similar to quantum confinement effects
observed in metal and/or semiconductor nanoparticles
less than 10 nm in size, this experimental result seems
to be due to a peculiar size effect in -conjugated
100 nm
organic and polymer nanocrystals, since the shift phe-
nomenon would appear even in the range of about more
than ten times greater size.
Figure 42.4
SEM photographs of TPB nanocrystals fabricated by
microwave irradiation method.
70 nm
150 nm
from the solution of SCF as the advanced technique of Nanofiber
conventional reprecipitation [13, 14]. That is, after the
target compounds were dissolved in SCF, the Absorbance
nanocrystals were fabricated by the reprecipitation
into poor solvent with cooling down. This technique
is called SCF crystallization (SCFC) method.
As an example, the fabrication of TiOPc (see
Fig. 42.1) nanocrystals using SCFC method is intro- 550 600 650 700 750
duced. First, it is significant that the solubility of Wavelength (nm)
TiOPc to acetone at 670 K and 22 MPa was about
0.5 g/L, i.e., 0.9 mM, because the value improved more Figure 42.5
than six figures than that at room temperature. In the Absorption spectra of aqueous dispersion of poly-DCHD
supercritical acetone system, crystal size and morphol- nanocrystals having different sizes.
ogy of TiOPc nanocrystals could be controlled by set-
ting suitable experimental conditions such as
temperature of SCF (T SCF ) and the ratio of acetone in
water for cooling solvent (R ). When only acetone was 630 : Length of a long
A
used for the cooling solvent; i.e., R 1, the size of
A
TiOPc nanocrystals obtained was larger than 500 nm. axis of nanofiber
On the other hand, as R became decreasing, the crys- 640
A
tal size tended to become smaller. When T SCF was set to
be lower than 300 K, the nanocrystals with 30 nm in Absorption peak position (nm)
size were fabricated. Regarding the modification 200 nm
forms, R gave larger influence than T SCF . When R A 650
A
was 1, the nanocrystals of stable type were produced.
And when the ratio of water to acetone for cooling sol-
vent was increased, the nanocrystals of metastable
type appeared. In summary, size and morphology of 660 10 100 1000 10000
TiOPc nanocrystals could be controlled by adjusting Crystal size (nm)
R and T SCF in SCFC method [14]. Moreover, it was
A
recognized that SCFC method was successfully appli- Figure 42.6
cable for other hardly soluble compounds such as Relationship between absorption peak positions and sizes
quinaridone or C [15, 16]. of poly-DCHD crystals.
60
599