
Page 53 - Nanotechnology an introduction
P. 53
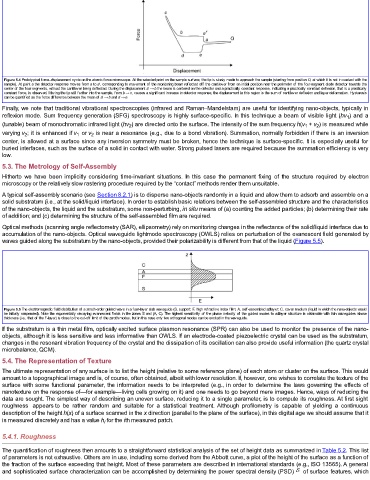
Figure 5.4 Prototypical force–displacement cycle on the atomic force microscope. At the selected point on the sample surface, the tip is slowly made to approach the sample (starting from position O, at which it is not in contact with the
  sample). At point a the detector response moves from a to a′, corresponding to movement of the monitoring beam reflected off the cantilever from an initial position near the perimeter of the four-segment diode detector towards the
  center of the four segments, without the cantilever being deflected. During the displacement a′ → b the beam is centered on the detector and a practically constant response, indicating a practically constant deflexion, that is a practically
  constant force, is observed. Moving the tip still further into the sample, from b → c, causes a significant increase in detector response; the displacement in this region is the sum of cantilever deflexion and layer deformation. Hysteresis
  can be quantified as the force difference between the mean of a′ → b and d → e.
  Finally, we note that traditional vibrational spectroscopies (infrared and Raman–Mandelstam) are useful for identifying nano-objects, typically in
  reflexion mode. Sum frequency generation (SFG) spectroscopy is highly surface-specific. In this technique a beam of visible light (hν ) and a
                                                                                                                   1
  (tunable) beam of monochromatic infrared light (hν ) are directed onto the surface. The intensity of the sum frequency h(ν  + ν ) is measured while
                                            2
                                                                                                      1
                                                                                                          2
  varying ν ; it is enhanced if ν  or ν  is near a resonance (e.g., due to a bond vibration). Summation, normally forbidden if there is an inversion
         2
                          1
                               2
  center, is allowed at a surface since any inversion symmetry must be broken, hence the technique is surface-specific. It is especially useful for
  buried interfaces, such as the surface of a solid in contact with water. Strong pulsed lasers are required because the summation efficiency is very
  low.
  5.3. The Metrology of Self-Assembly
  Hitherto  we  have  been  implicitly  considering  time-invariant  situations.  In  this  case  the  permanent  fixing  of  the  structure  required  by  electron
  microscopy or the relatively slow rastering procedure required by the “contact” methods render them unsuitable.
  A typical self-assembly scenario (see Section 8.2.1) is to disperse nano-objects randomly in a liquid and allow them to adsorb and assemble on a
  solid substratum (i.e., at the solid/liquid interface). In order to establish basic relations between the self-assembled structure and the characteristics
  of the nano-objects, the liquid and the substratum, some non-perturbing, in situ means of (a) counting the added particles; (b) determining their rate
  of addition; and (c) determining the structure of the self-assembled film are required.
  Optical methods (scanning angle reflectometry (SAR), ellipsometry) rely on monitoring changes in the reflectance of the solid/liquid interface due to
  accumulation of the nano-objects. Optical waveguide lightmode spectroscopy (OWLS) relies on perturbation of the evanescent field generated by
  waves guided along the substratum by the nano-objects, provided their polarizability is different from that of the liquid (Figure 5.5).


  Figure 5.5 The electromagnetic field distribution of a zeroth-order guided wave in a four-layer slab waveguide (S, support; F, high refractive index film; A, self-assembled adlayer; C, cover medium (liquid in which the nano-objects would
  be initially suspended). Note the exponentially decaying evanescent fields in the zones S and (A, C). The highest sensitivity of the phase velocity of the guided modes to adlayer structure is obtainable with thin waveguides whose
  thickness (i.e., that of the F-layer) is close to the cut-off limit of the zeroth modes, but in this case only two orthogonal modes can be excited in the waveguide.
  If the substratum is a thin metal film, optically excited surface plasmon resonance (SPR) can also be used to monitor the presence of the nano-
  objects, although it is less sensitive and less informative than OWLS. If an electrode-coated piezoelectric crystal can be used as the substratum,
  changes in the resonant vibration frequency of the crystal and the dissipation of its oscillation can also provide useful information (the quartz crystal
  microbalance, QCM).
  5.4. The Representation of Texture
  The ultimate representation of any surface is to list the height (relative to some reference plane) of each atom or cluster on the surface. This would
  amount to a topographical image and is, of course, often obtained, albeit with lower resolution. If, however, one wishes to correlate the texture of the
  surface with some functional parameter, the information needs to be interpreted (e.g., in order to determine the laws governing the effects of
  nanotexture on the response of—for example—living cells growing on it) and one needs to go beyond mere images. Hence, ways of reducing the
  data are sought. The simplest way of describing an uneven surface, reducing it to a single parameter, is to compute its roughness. At first sight
  roughness  appears to  be  rather  random  and  suitable  for  a  statistical  treatment.  Although  profilometry  is  capable  of  yielding  a  continuous
  description of the height h(x) of a surface scanned in the x direction (parallel to the plane of the surface), in this digital age we should assume that it
  is measured discretely and has a value h for the ith measured patch.
                                   i

  5.4.1. Roughness
  The quantification of roughness then amounts to a straightforward statistical analysis of the set of height data as summarized in Table 5.2. This list
  of parameters is not exhaustive. Others are in use, including some derived from the Abbott curve, a plot of the height of the surface as a function of
  the fraction of the surface exceeding that height. Most of these parameters are described in international standards (e.g., ISO 13565). A general
  and sophisticated surface characterization can be accomplished by determining the power spectral density (PSD)   of surface features, which