
Page 165 - Neural Network Modeling and Identification of Dynamical Systems
P. 165
4.3 APPLICATION OF ANN MODELS TO ADAPTIVE CONTROL PROBLEMS UNDER UNCERTAINTY CONDITIONS 155
y
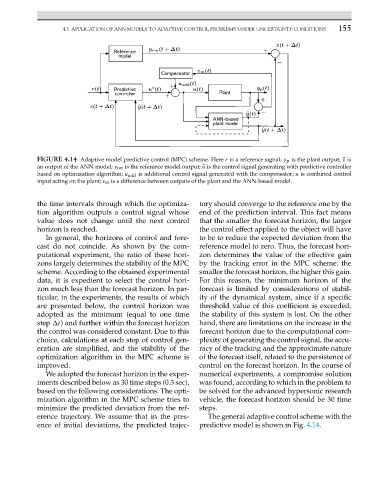
FIGURE 4.14 Adaptive model predictive control (MPC) scheme. Here r is a reference signal; y p is the plant output; is
an output of the ANN model; y rm is the reference model output; u is the control signal generating with predictive controller
based on optimization algorithm; u add is additional control signal generated with the compensator; u is combined control
input acting on the plant; ε m is a difference between outputs of the plant and the ANN-based model.
the time intervals through which the optimiza- tory should converge to the reference one by the
tion algorithm outputs a control signal whose end of the prediction interval. This fact means
value does not change until the next control that the smaller the forecast horizon, the larger
horizon is reached. the control effect applied to the object will have
In general, the horizons of control and fore- to be to reduce the expected deviation from the
cast do not coincide. As shown by the com- reference model to zero. Thus, the forecast hori-
putational experiment, the ratio of these hori- zon determines the value of the effective gain
zons largely determines the stability of the MPC by the tracking error in the MPC scheme: the
scheme. According to the obtained experimental smaller the forecast horizon, the higher this gain.
data, it is expedient to select the control hori- For this reason, the minimum horizon of the
zon much less than the forecast horizon. In par- forecast is limited by considerations of stabil-
ticular, in the experiments, the results of which ity of the dynamical system, since if a specific
are presented below, the control horizon was threshold value of this coefficient is exceeded,
adopted as the minimum (equal to one time the stability of this system is lost. On the other
step
t) and further within the forecast horizon hand, there are limitations on the increase in the
the control was considered constant. Due to this forecast horizon due to the computational com-
choice, calculations at each step of control gen- plexity of generating the control signal, the accu-
eration are simplified, and the stability of the racy of the tracking and the approximate nature
optimization algorithm in the MPC scheme is of the forecast itself, related to the persistence of
improved. control on the forecast horizon. In the course of
We adopted the forecast horizon in the exper- numerical experiments, a compromise solution
iments described below as 30 time steps (0.3 sec), was found, according to which in the problem to
based on the following considerations. The opti- be solved for the advanced hypersonic research
mization algorithm in the MPC scheme tries to vehicle, the forecast horizon should be 30 time
minimize the predicted deviation from the ref- steps.
erence trajectory. We assume that in the pres- The general adaptive control scheme with the
ence of initial deviations, the predicted trajec- predictive model is shown in Fig. 4.14.